
Our stock screening tool has pinpointed CORCEPT THERAPEUTICS INC (NASDAQ:CORT) as a growth stock that isn't overvalued. NASDAQ:CORT is excelling in various growth indicators while maintaining a solid financial footing. Furthermore, it remains attractively priced. Let's delve into the specifics below.
Exploring NASDAQ:CORT's Growth
A key component of ChartMill's stock assessment is the Growth Rating, which spans from 0 to 10. This rating evaluates diverse growth factors, such as EPS and revenue growth, considering both past performance and future projections. NASDAQ:CORT has received a 8 out of 10:
- CORT shows a strong growth in Earnings Per Share. In the last year, the EPS has been growing by 36.14%, which is quite impressive.
- Looking at the last year, CORT shows a very strong growth in Revenue. The Revenue has grown by 33.02%.
- Measured over the past years, CORT shows a quite strong growth in Revenue. The Revenue has been growing by 13.94% on average per year.
- Based on estimates for the next years, CORT will show a very strong growth in Earnings Per Share. The EPS will grow by 26.44% on average per year.
- Based on estimates for the next years, CORT will show a quite strong growth in Revenue. The Revenue will grow by 16.69% on average per year.
- When comparing the EPS growth rate of the last years to the growth rate of the upcoming years, we see that the growth is accelerating.
A Closer Look at Valuation for NASDAQ:CORT
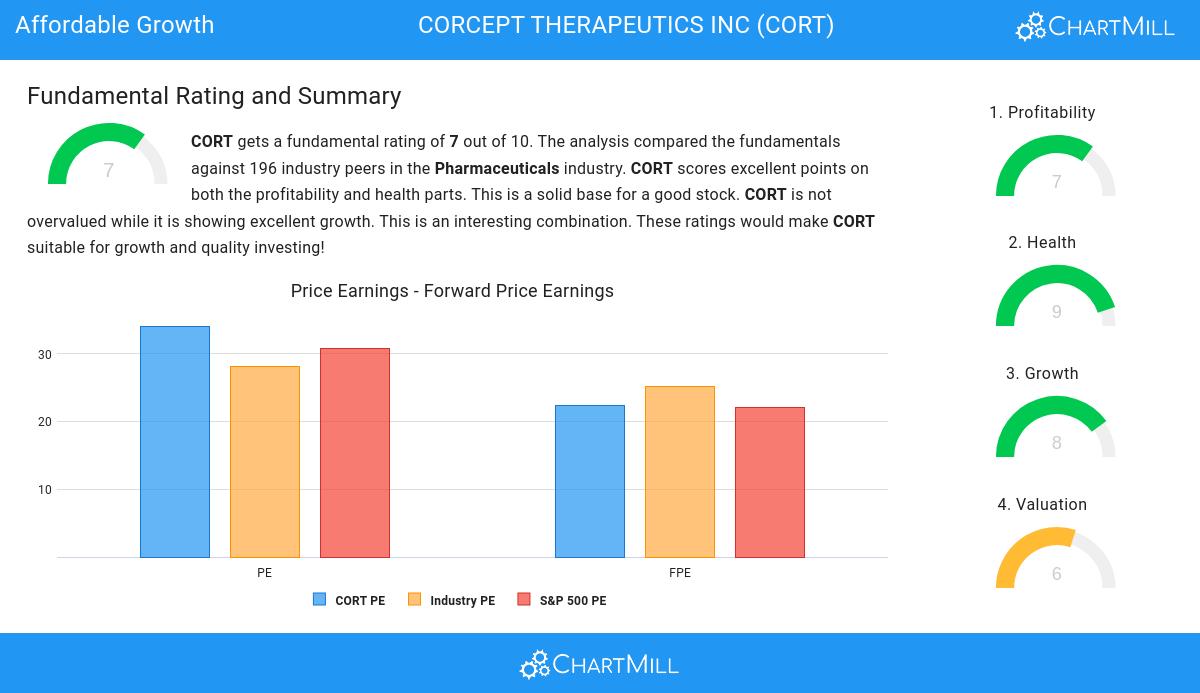
ChartMill provides a Valuation Rating to every stock, ranging from 0 to 10. This rating assesses various valuation aspects, comparing price to earnings and cash flows, while considering factors like profitability and growth. NASDAQ:CORT boasts a 6 out of 10:
- Based on the Price/Earnings ratio, CORT is valued cheaply inside the industry as 82.56% of the companies are valued more expensively.
- 77.95% of the companies in the same industry are more expensive than CORT, based on the Price/Forward Earnings ratio.
- Based on the Enterprise Value to EBITDA ratio, CORT is valued cheaply inside the industry as 80.51% of the companies are valued more expensively.
- 82.56% of the companies in the same industry are more expensive than CORT, based on the Price/Free Cash Flow ratio.
- CORT has a very decent profitability rating, which may justify a higher PE ratio.
- CORT's earnings are expected to grow with 52.60% in the coming years. This may justify a more expensive valuation.
Health Assessment of NASDAQ:CORT
ChartMill assigns a Health Rating to every stock. This score ranges from 0 to 10 and evaluates the different health aspects like liquidity and solvency, both absolutely, but also relative to the industry peers. NASDAQ:CORT scores a 9 out of 10:
- An Altman-Z score of 23.46 indicates that CORT is not in any danger for bankruptcy at the moment.
- CORT's Altman-Z score of 23.46 is amongst the best of the industry. CORT outperforms 90.77% of its industry peers.
- There is no outstanding debt for CORT. This means it has a Debt/Equity and Debt/FCF ratio of 0 and it is amongst the best of the sector and industry.
- A Current Ratio of 5.57 indicates that CORT has no problem at all paying its short term obligations.
- With a decent Current ratio value of 5.57, CORT is doing good in the industry, outperforming 68.21% of the companies in the same industry.
- CORT has a Quick Ratio of 5.48. This indicates that CORT is financially healthy and has no problem in meeting its short term obligations.
- CORT has a better Quick ratio (5.48) than 68.21% of its industry peers.
How do we evaluate the Profitability for NASDAQ:CORT?
ChartMill employs its own Profitability Rating system for stock evaluation. This score, ranging from 0 to 10, is derived from an analysis of diverse profitability metrics and margins. In the case of NASDAQ:CORT, the assigned 7 is noteworthy for profitability:
- Looking at the Return On Assets, with a value of 17.63%, CORT belongs to the top of the industry, outperforming 96.92% of the companies in the same industry.
- CORT has a Return On Equity of 21.13%. This is amongst the best in the industry. CORT outperforms 92.31% of its industry peers.
- The Return On Invested Capital of CORT (17.98%) is better than 94.36% of its industry peers.
- With an excellent Profit Margin value of 22.12%, CORT belongs to the best of the industry, outperforming 93.85% of the companies in the same industry.
- The Operating Margin of CORT (22.46%) is better than 89.23% of its industry peers.
- The Gross Margin of CORT (98.50%) is better than 97.95% of its industry peers.
Every day, new Affordable Growth stocks can be found on ChartMill in our Affordable Growth screener.
For an up to date full fundamental analysis you can check the fundamental report of CORT
Disclaimer
Important Note: The content of this article is not intended as trading advice. It is essential to perform your own analysis and exercise caution when making trading decisions. The article presents observations created by automated analysis but does not guarantee any trading or investment outcomes. Always trade responsibly and make independent judgments.