
Good technical signals and a possible breakout for CMS ENERGY CORP.
By Mill Chart
Last update: Oct 25, 2024
A possible breakout setup was detected on CMS ENERGY CORP (NYSE:CMS) by our stockscreener. A breakout pattern is formed when a stock consolidates after a strong rise up. We note that this pattern is detected purely based on technical analysis and whether the breakout actually materializes remains to be seen. It could be interesting to keep an eye on NYSE:CMS.
Zooming in on the technicals.
Every day, ChartMill assigns a Technical Rating to each stock, providing a score ranging from 0 to 10. This rating is determined by evaluating various technical indicators and properties.
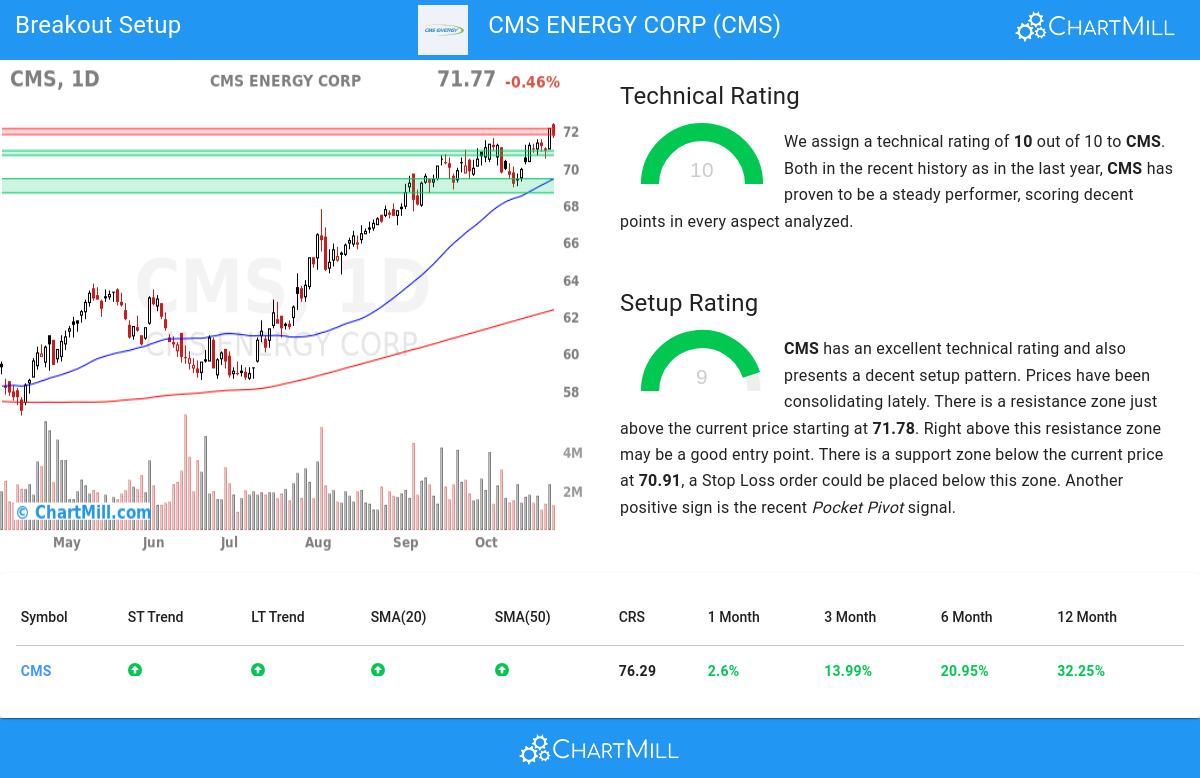
We assign a technical rating of 10 out of 10 to CMS. Both in the recent history as in the last year, CMS has proven to be a steady performer, scoring decent points in every aspect analyzed.
- The long and short term trends are both positive. This is looking good!
- Looking at the yearly performance, CMS did better than 76% of all other stocks. On top of that, CMS also shows a nice and consistent pattern of rising prices.
- CMS is part of the Multi-Utilities industry. There are 25 other stocks in this industry. CMS outperforms 79% of them.
- A new 52 week high is currently being made by CMS, which is a very good signal! However, this is in line with the S&P500, which is also trading near new highs.
- In the last month CMS has a been trading in a tight range between 68.96 and 72.40.
Our latest full technical report of CMS contains the most current technical analsysis.
How does the Setup look for NYSE:CMS
Besides the Technical Rating, ChartMill assigns a Setup Rating to every stock to determine the degree of consolidation. This rating, ranging from 0 to 10, is updated daily and evaluates various short-term technical indicators. NYSE:CMS currently holds a 9 as its setup rating, suggesting a particular level of consolidation in the stock.
CMS has an excellent technical rating and also presents a decent setup pattern. Prices have been consolidating lately. There is a resistance zone just above the current price starting at 71.78. Right above this resistance zone may be a good entry point. There is a support zone below the current price at 70.91, a Stop Loss order could be placed below this zone. Another positive sign is the recent Pocket Pivot signal.
Trading breakout setups.
One way to play this would be to wait for the actual breakout to happen and buy when the stock breaks out above the current consolidation zone. A possible place for a stop loss would be below this zone.
This article should in no way be interpreted as trading advice. You should always make your own analysis and trade or not trade based on your own observations and style. The article is based purely on some technical observations.
More breakout setups can be found in our Breakout screener.
Disclaimer
This is not investing advice! The article highlights some of the observations at the time of writing, but you should always make your own analysis and invest based on your own insights.
69.84
+0.1 (+0.14%)
Find more stocks in the Stock Screener
CMS Latest News and Analysis
