
Based on good technical signals, COMERICA INC is potentially setting up for a breakout.
By Mill Chart
Last update: Sep 10, 2024
A possible breakout setup was detected on COMERICA INC (NYSE:CMA) by our stockscreener. A breakout pattern is formed when a stock consolidates after a strong rise up. We note that this pattern is detected purely based on technical analysis and whether the breakout actually materializes remains to be seen. It could be interesting to keep an eye on NYSE:CMA.
Deciphering the Technical Picture of NYSE:CMA
ChartMill assigns a Technical Rating to every stock. This score, ranging from 0 to 10, is updated daily and is determined by evaluating multiple technical indicators and properties.
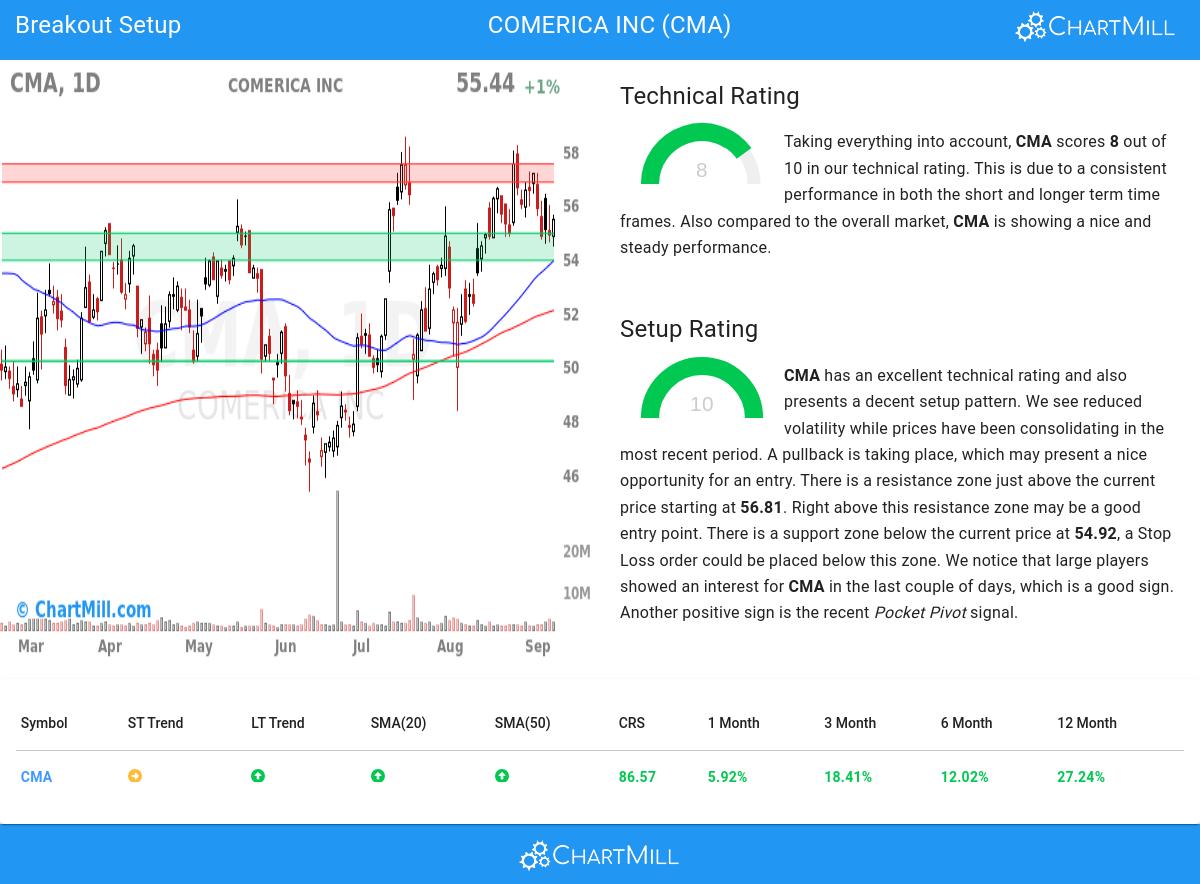
We assign a technical rating of 8 out of 10 to CMA. Both in the recent history as in the last year, CMA has proven to be a steady performer, scoring decent points in every aspect analyzed.
- The long term trend is positive and the short term trend is neutral. The long term trend may just continue or reversal may be around the corner!
- CMA is currently trading in the upper part of its 52 week range. The S&P500 Index is also trading in the upper part of its 52 week range, so CMA is performing more or less in line with the market.
- In the last month CMA has a been trading in the 53.32 - 58.19 range, which is quite wide. It is currently trading in the middle of this range where prices have been consolidating recently, this may present a good entry opportunity, but some resistance may be present above.
- Looking at the yearly performance, CMA did better than 86% of all other stocks. However, this overall performance is mostly based on the strong move around 10 months ago.
- CMA is part of the Banks industry. There are 400 other stocks in this industry, CMA did better than 59% of them.
Check the latest full technical report of CMA for a complete technical analysis.
How do we evaluate the setup for NYSE:CMA?
Next to the Technical Rating, the Setup Rating of a stock determines to which extend the stock is consolidating. This score also ranges from 0 to 10 and is updated daily. The setup score evaluates various short term technical indicators. For NYSE:CMA this score is currently 10:
CMA has an excellent technical rating and also presents a decent setup pattern. We see reduced volatility while prices have been consolidating in the most recent period. A pullback is taking place, which may present a nice opportunity for an entry. There is a resistance zone just above the current price starting at 56.81. Right above this resistance zone may be a good entry point. There is a support zone below the current price at 54.92, a Stop Loss order could be placed below this zone. We notice that large players showed an interest for CMA in the last couple of days, which is a good sign. Very recently a Pocket Pivot signal was observed. This is another positive sign.
How to trade NYSE:CMA?
A breakout opportunity may arise when the stock surpasses the current consolidation zone and reaches new highs. Traders often wait for this breakout before considering buying the stock. To manage risk, a stop loss order could be placed below the consolidation zone to limit potential losses.
Disclaimer: This article is not intended to provide trading advice. It is crucial to conduct your own analysis and consider your own observations and trading style when making investment decisions. The article solely presents technical observations and should not be relied upon as a sole basis for trading.
Our Breakout screener lists more breakout setups and is updated daily.
Disclaimer
This article should in no way be interpreted as advice. The article is based on the observed metrics at the time of writing, but you should always make your own analysis and trade or invest at your own responsibility.