
NYSE:CLS appears to be flying under the radar despite its strong fundamentals.
By Mill Chart
Last update: Oct 24, 2024
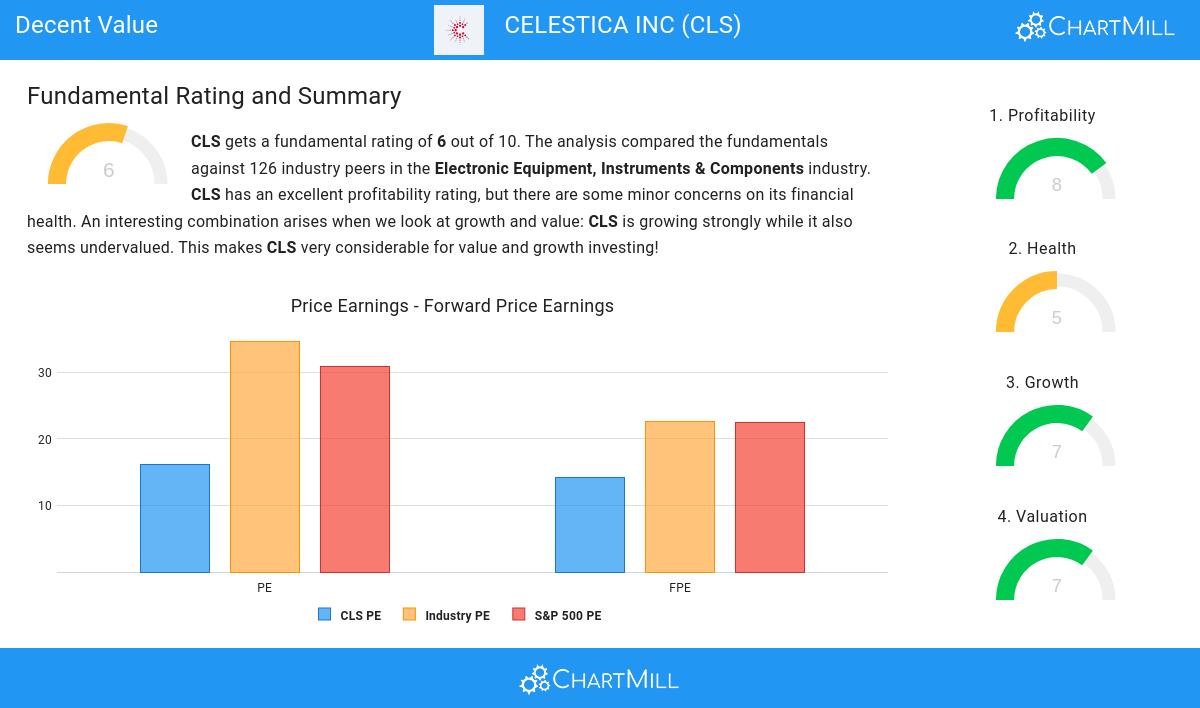
CELESTICA INC (NYSE:CLS) is a hidden gem identified by our stock screening tool, featuring undervaluation and robust fundamentals. NYSE:CLS showcases decent financial health and profitability, coupled with an attractive price. Let's dig deeper into the analysis.
Exploring NYSE:CLS's Valuation
An integral part of ChartMill's stock analysis is the Valuation Rating, which spans from 0 to 10. This rating evaluates diverse valuation factors, including price to earnings and cash flows, while considering the stock's profitability and growth. NYSE:CLS has received a 7 out of 10:
- 82.40% of the companies in the same industry are more expensive than CLS, based on the Price/Earnings ratio.
- Compared to an average S&P500 Price/Earnings ratio of 30.85, CLS is valued a bit cheaper.
- Based on the Price/Forward Earnings ratio, CLS is valued cheaply inside the industry as 84.00% of the companies are valued more expensively.
- CLS is valuated rather cheaply when we compare the Price/Forward Earnings ratio to 22.48, which is the current average of the S&P500 Index.
- 77.60% of the companies in the same industry are more expensive than CLS, based on the Enterprise Value to EBITDA ratio.
- CLS's Price/Free Cash Flow ratio is a bit cheaper when compared to the industry. CLS is cheaper than 73.60% of the companies in the same industry.
- CLS's low PEG Ratio(NY), which compensates the Price/Earnings for growth, indicates a rather cheap valuation of the company.
- CLS has an outstanding profitability rating, which may justify a higher PE ratio.
- CLS's earnings are expected to grow with 22.66% in the coming years. This may justify a more expensive valuation.
Evaluating Profitability: NYSE:CLS
ChartMill utilizes a Profitability Rating to assess stocks, scoring them on a scale of 0 to 10. This rating takes into account a variety of profitability ratios and margins, both in absolute terms and in comparison to industry peers. NYSE:CLS has earned a 8 out of 10:
- CLS has a better Return On Assets (6.22%) than 79.20% of its industry peers.
- The Return On Equity of CLS (20.28%) is better than 92.00% of its industry peers.
- Looking at the Return On Invested Capital, with a value of 13.13%, CLS belongs to the top of the industry, outperforming 89.60% of the companies in the same industry.
- The 3 year average ROIC (8.21%) for CLS is below the current ROIC(13.13%), indicating increased profibility in the last year.
- CLS has a Profit Margin of 4.16%. This is in the better half of the industry: CLS outperforms 67.20% of its industry peers.
- CLS's Profit Margin has improved in the last couple of years.
- Looking at the Operating Margin, with a value of 5.68%, CLS is in the better half of the industry, outperforming 68.80% of the companies in the same industry.
- In the last couple of years the Operating Margin of CLS has grown nicely.
- CLS's Gross Margin has improved in the last couple of years.
Health Analysis for NYSE:CLS
ChartMill utilizes a Health Rating to assess stocks, scoring them on a scale of 0 to 10. This rating takes into account a variety of liquidity and solvency ratios, both in absolute terms and in comparison to industry peers. NYSE:CLS has earned a 5 out of 10:
- The Debt to FCF ratio of CLS is 2.77, which is a good value as it means it would take CLS, 2.77 years of fcf income to pay off all of its debts.
- Looking at the Debt to FCF ratio, with a value of 2.77, CLS is in the better half of the industry, outperforming 68.00% of the companies in the same industry.
- CLS has a Debt/Equity ratio of 0.49. This is a healthy value indicating a solid balance between debt and equity.
Growth Analysis for NYSE:CLS
ChartMill assigns a Growth Rating to every stock. This score ranges from 0 to 10 and evaluates the different growth aspects like EPS and Revenue, both in the past as in the future. NYSE:CLS scores a 7 out of 10:
- The Earnings Per Share has grown by an impressive 60.09% over the past year.
- Measured over the past years, CLS shows a quite strong growth in Earnings Per Share. The EPS has been growing by 17.61% on average per year.
- The Revenue has grown by 9.81% in the past year. This is quite good.
- Based on estimates for the next years, CLS will show a very strong growth in Earnings Per Share. The EPS will grow by 22.66% on average per year.
- Based on estimates for the next years, CLS will show a quite strong growth in Revenue. The Revenue will grow by 14.09% on average per year.
- The EPS growth rate is accelerating: in the next years the growth will be better than in the last years.
- The Revenue growth rate is accelerating: in the next years the growth will be better than in the last years.
Every day, new Decent Value stocks can be found on ChartMill in our Decent Value screener.
For an up to date full fundamental analysis you can check the fundamental report of CLS
Keep in mind
This is not investing advice! The article highlights some of the observations at the time of writing, but you should always make your own analysis and invest based on your own insights.
84.04
+3.48 (+4.32%)
Find more stocks in the Stock Screener
CLS Latest News and Analysis
 7 days ago - ChartmillCELESTICA INC (NYSE:CLS) is showing good growth, while it is not too expensive.
Based on Fundamental Analysis it can be said that NYSE:CLS is a growth stock which is not overvalued.
