NYSE:CLS is not too expensive for the growth it is showing.
By Mill Chart
Last update: Oct 23, 2024
Our stock screening tool has pinpointed CELESTICA INC (NYSE:CLS) as a growth stock that isn't overvalued. NYSE:CLS is excelling in various growth indicators while maintaining a solid financial footing. Furthermore, it remains attractively priced. Let's delve into the specifics below.
Unpacking NYSE:CLS's Growth Rating
ChartMill assigns a Growth Rating to each stock, ranging from 0 to 10. This rating is determined by analyzing different growth elements, including EPS and revenue growth, spanning both historical and future figures. In the case of NYSE:CLS, the assigned 7 reflects its growth potential:
- The Earnings Per Share has grown by an impressive 51.43% over the past year.
- CLS shows quite a strong growth in Earnings Per Share. Measured over the last years, the EPS has been growing by 17.61% yearly.
- The Revenue has grown by 13.45% in the past year. This is quite good.
- The Earnings Per Share is expected to grow by 22.66% on average over the next years. This is a very strong growth
- CLS is expected to show quite a strong growth in Revenue. In the coming years, the Revenue will grow by 14.09% yearly.
- When comparing the EPS growth rate of the last years to the growth rate of the upcoming years, we see that the growth is accelerating.
- When comparing the Revenue growth rate of the last years to the growth rate of the upcoming years, we see that the growth is accelerating.
Assessing Valuation Metrics for NYSE:CLS
ChartMill assigns a Valuation Rating to each stock, ranging from 0 to 10. This rating is calculated by analyzing different valuation elements, such as price to earnings and free cash flow, both in absolute terms and relative to the market and industry. In the case of NYSE:CLS, the assigned 7 reflects its valuation:
- CLS's Price/Earnings ratio is rather cheap when compared to the industry. CLS is cheaper than 80.80% of the companies in the same industry.
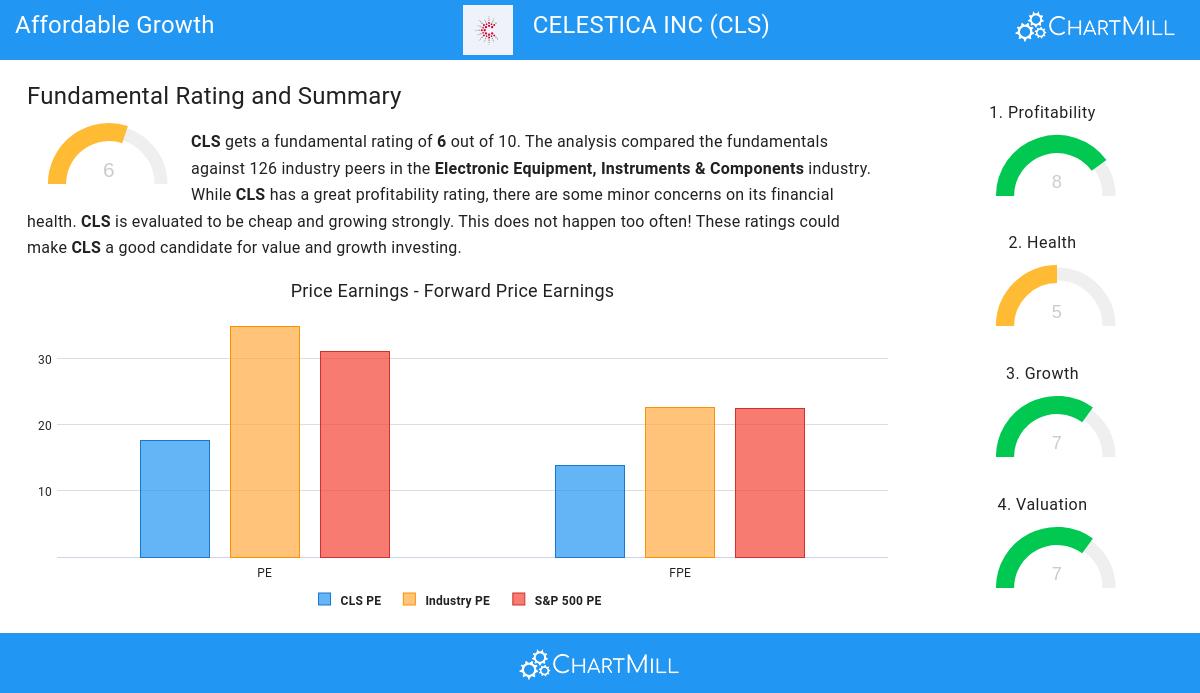
- When comparing the Price/Earnings ratio of CLS to the average of the S&P500 Index (31.10), we can say CLS is valued slightly cheaper.
- Based on the Price/Forward Earnings ratio, CLS is valued cheaper than 84.00% of the companies in the same industry.
- The average S&P500 Price/Forward Earnings ratio is at 22.54. CLS is valued slightly cheaper when compared to this.
- 77.60% of the companies in the same industry are more expensive than CLS, based on the Enterprise Value to EBITDA ratio.
- Based on the Price/Free Cash Flow ratio, CLS is valued a bit cheaper than the industry average as 73.60% of the companies are valued more expensively.
- The low PEG Ratio(NY), which compensates the Price/Earnings for growth, indicates a rather cheap valuation of the company.
- The excellent profitability rating of CLS may justify a higher PE ratio.
- CLS's earnings are expected to grow with 22.66% in the coming years. This may justify a more expensive valuation.
Deciphering NYSE:CLS's Health Rating
ChartMill assigns a proprietary Health Rating to each stock. The score is computed by evaluating various liquidity and solvency ratios and ranges from 0 to 10. NYSE:CLS was assigned a score of 5 for health:
- The Debt to FCF ratio of CLS is 2.77, which is a good value as it means it would take CLS, 2.77 years of fcf income to pay off all of its debts.
- CLS's Debt to FCF ratio of 2.77 is fine compared to the rest of the industry. CLS outperforms 68.00% of its industry peers.
- A Debt/Equity ratio of 0.49 indicates that CLS is not too dependend on debt financing.
Analyzing Profitability Metrics
ChartMill utilizes a Profitability Rating to assess stocks, scoring them on a scale of 0 to 10. This rating takes into account a variety of profitability ratios and margins, both in absolute terms and in comparison to industry peers. NYSE:CLS has earned a 8 out of 10:
- CLS has a better Return On Assets (6.22%) than 79.20% of its industry peers.
- CLS has a Return On Equity of 20.28%. This is amongst the best in the industry. CLS outperforms 92.00% of its industry peers.
- CLS's Return On Invested Capital of 13.13% is amongst the best of the industry. CLS outperforms 89.60% of its industry peers.
- The last Return On Invested Capital (13.13%) for CLS is above the 3 year average (8.21%), which is a sign of increasing profitability.
- Looking at the Profit Margin, with a value of 4.16%, CLS is in the better half of the industry, outperforming 67.20% of the companies in the same industry.
- In the last couple of years the Profit Margin of CLS has grown nicely.
- CLS's Operating Margin of 5.68% is fine compared to the rest of the industry. CLS outperforms 68.80% of its industry peers.
- In the last couple of years the Operating Margin of CLS has grown nicely.
- CLS's Gross Margin has improved in the last couple of years.
Our Affordable Growth screener lists more Affordable Growth stocks and is updated daily.
Our latest full fundamental report of CLS contains the most current fundamental analsysis.
Keep in mind
This article should in no way be interpreted as advice. The article is based on the observed metrics at the time of writing, but you should always make your own analysis and trade or invest at your own responsibility.
84.04
+3.48 (+4.32%)
Find more stocks in the Stock Screener
CLS Latest News and Analysis
 7 days ago - ChartmillCELESTICA INC (NYSE:CLS) is showing good growth, while it is not too expensive.
Based on Fundamental Analysis it can be said that NYSE:CLS is a growth stock which is not overvalued.
