For those who appreciate growth without the sticker shock, NYSE:CLS is worth considering.
By Mill Chart
Last update: Oct 2, 2024
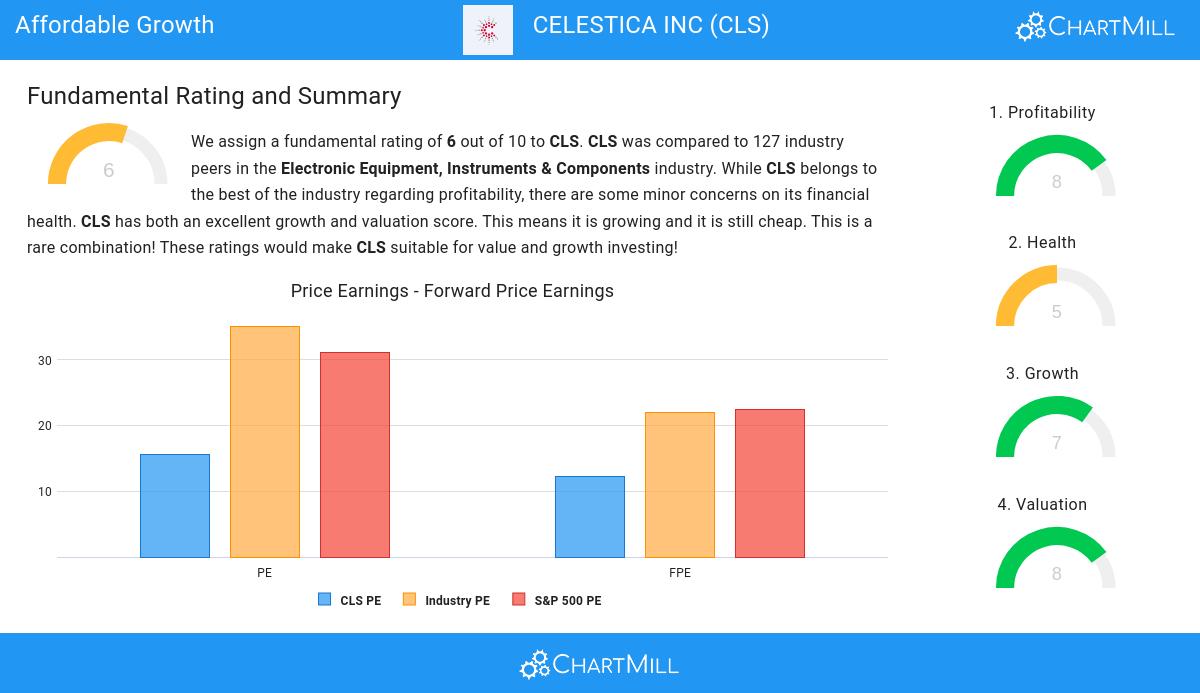
Our stock screener has spotted CELESTICA INC (NYSE:CLS) as a growth stock which is not overvalued. NYSE:CLS is scoring great on several growth aspects while it also shows decent health and profitability. At the same time it remains remains attractively priced. We'll dive into each aspect below.
Assessing Growth Metrics for NYSE:CLS
ChartMill employs its own Growth Rating system for all stocks. This score, ranging from 0 to 10, is derived by evaluating different growth factors, such as EPS and revenue growth, taking into account both past performance and future projections. NYSE:CLS has earned a 7 for growth:
- The Earnings Per Share has grown by an impressive 51.43% over the past year.
- The Earnings Per Share has been growing by 17.61% on average over the past years. This is quite good.
- Looking at the last year, CLS shows a quite strong growth in Revenue. The Revenue has grown by 13.45% in the last year.
- Based on estimates for the next years, CLS will show a very strong growth in Earnings Per Share. The EPS will grow by 22.66% on average per year.
- CLS is expected to show quite a strong growth in Revenue. In the coming years, the Revenue will grow by 14.09% yearly.
- When comparing the EPS growth rate of the last years to the growth rate of the upcoming years, we see that the growth is accelerating.
- When comparing the Revenue growth rate of the last years to the growth rate of the upcoming years, we see that the growth is accelerating.
ChartMill's Evaluation of Valuation
An integral part of ChartMill's stock analysis is the Valuation Rating, which spans from 0 to 10. This rating evaluates diverse valuation factors, including price to earnings and cash flows, while considering the stock's profitability and growth. NYSE:CLS has received a 8 out of 10:
- 82.54% of the companies in the same industry are more expensive than CLS, based on the Price/Earnings ratio.
- Compared to an average S&P500 Price/Earnings ratio of 31.08, CLS is valued a bit cheaper.
- 87.30% of the companies in the same industry are more expensive than CLS, based on the Price/Forward Earnings ratio.
- CLS's Price/Forward Earnings ratio indicates a valuation a bit cheaper than the S&P500 average which is at 22.39.
- CLS's Enterprise Value to EBITDA ratio is rather cheap when compared to the industry. CLS is cheaper than 80.95% of the companies in the same industry.
- Compared to the rest of the industry, the Price/Free Cash Flow ratio of CLS indicates a somewhat cheap valuation: CLS is cheaper than 76.98% of the companies listed in the same industry.
- CLS's low PEG Ratio(NY), which compensates the Price/Earnings for growth, indicates a rather cheap valuation of the company.
- The excellent profitability rating of CLS may justify a higher PE ratio.
- A more expensive valuation may be justified as CLS's earnings are expected to grow with 22.66% in the coming years.
A Closer Look at Health for NYSE:CLS
A critical element of ChartMill's stock evaluation is the Health Rating, which spans from 0 to 10. This rating considers multiple health factors, including liquidity and solvency, both in absolute terms and relative to industry peers. NYSE:CLS has received a 5 out of 10:
- The Debt to FCF ratio of CLS is 2.77, which is a good value as it means it would take CLS, 2.77 years of fcf income to pay off all of its debts.
- The Debt to FCF ratio of CLS (2.77) is better than 68.25% of its industry peers.
- CLS has a Debt/Equity ratio of 0.49. This is a healthy value indicating a solid balance between debt and equity.
Profitability Examination for NYSE:CLS
Discover ChartMill's exclusive Profitability Rating, a proprietary metric that assesses stocks on a scale of 0 to 10. It takes into consideration various profitability ratios and margins, both in absolute terms and relative to industry peers. Notably, NYSE:CLS has achieved a 8:
- CLS's Return On Assets of 6.22% is fine compared to the rest of the industry. CLS outperforms 79.37% of its industry peers.
- CLS has a better Return On Equity (20.28%) than 92.06% of its industry peers.
- CLS has a Return On Invested Capital of 13.13%. This is amongst the best in the industry. CLS outperforms 89.68% of its industry peers.
- The 3 year average ROIC (8.21%) for CLS is below the current ROIC(13.13%), indicating increased profibility in the last year.
- CLS's Profit Margin of 4.16% is fine compared to the rest of the industry. CLS outperforms 67.46% of its industry peers.
- In the last couple of years the Profit Margin of CLS has grown nicely.
- CLS has a better Operating Margin (5.68%) than 69.05% of its industry peers.
- CLS's Operating Margin has improved in the last couple of years.
- CLS's Gross Margin has improved in the last couple of years.
Our Affordable Growth screener lists more Affordable Growth stocks and is updated daily.
Check the latest full fundamental report of CLS for a complete fundamental analysis.
Disclaimer
This article should in no way be interpreted as advice. The article is based on the observed metrics at the time of writing, but you should always make your own analysis and trade or invest at your own responsibility.
84.04
+3.48 (+4.32%)
Find more stocks in the Stock Screener
CLS Latest News and Analysis
 7 days ago - ChartmillCELESTICA INC (NYSE:CLS) is showing good growth, while it is not too expensive.
Based on Fundamental Analysis it can be said that NYSE:CLS is a growth stock which is not overvalued.
