
NYSE:CLS is an undervalued gem with solid fundamentals.
By Mill Chart
Last update: Oct 1, 2024
Consider CELESTICA INC (NYSE:CLS) as a top value stock, identified by our stock screening tool. NYSE:CLS shines in terms of profitability, solvency, and liquidity, all while remaining very reasonably priced. Let's dive deeper into the analysis.
What does the Valuation looks like for NYSE:CLS
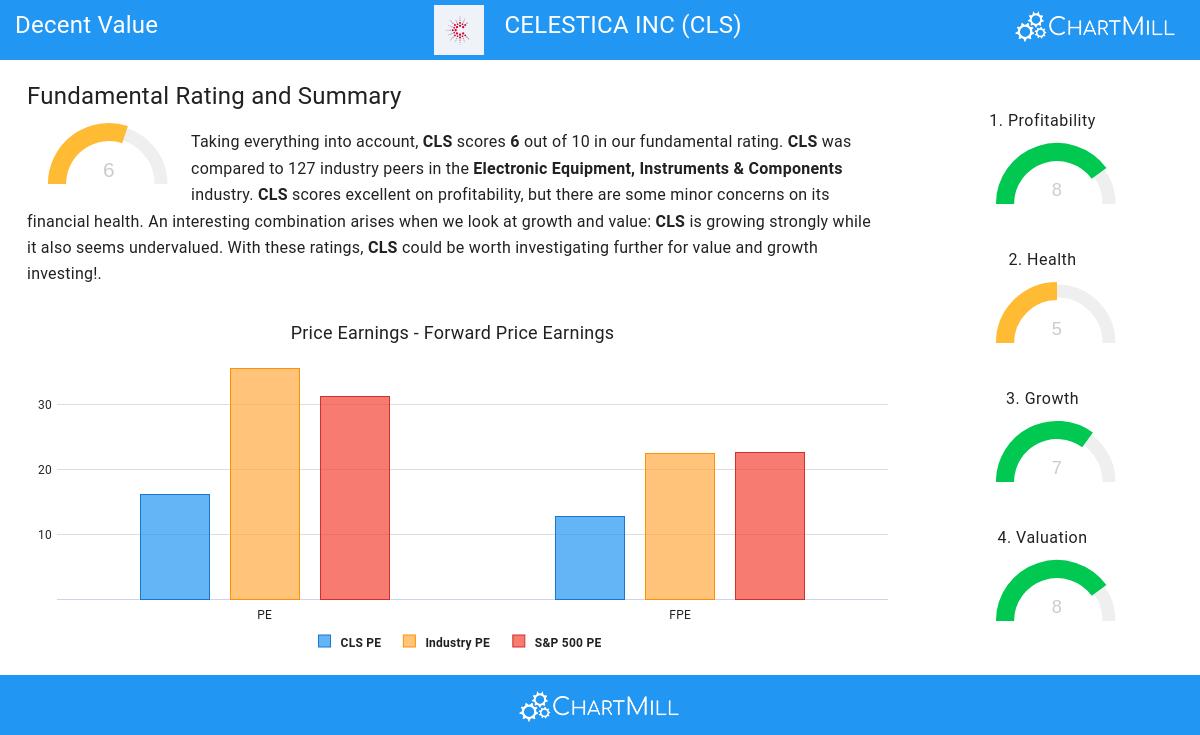
ChartMill assigns a Valuation Rating to each stock, ranging from 0 to 10. This rating is calculated by analyzing different valuation elements, such as price to earnings and free cash flow, both in absolute terms and relative to the market and industry. In the case of NYSE:CLS, the assigned 8 reflects its valuation:
- Based on the Price/Earnings ratio, CLS is valued cheaper than 82.54% of the companies in the same industry.
- Compared to an average S&P500 Price/Earnings ratio of 31.26, CLS is valued a bit cheaper.
- CLS's Price/Forward Earnings ratio is rather cheap when compared to the industry. CLS is cheaper than 88.10% of the companies in the same industry.
- CLS's Price/Forward Earnings ratio indicates a valuation a bit cheaper than the S&P500 average which is at 22.55.
- Compared to the rest of the industry, the Enterprise Value to EBITDA ratio of CLS indicates a rather cheap valuation: CLS is cheaper than 80.95% of the companies listed in the same industry.
- Compared to the rest of the industry, the Price/Free Cash Flow ratio of CLS indicates a somewhat cheap valuation: CLS is cheaper than 76.19% of the companies listed in the same industry.
- The low PEG Ratio(NY), which compensates the Price/Earnings for growth, indicates a rather cheap valuation of the company.
- The excellent profitability rating of CLS may justify a higher PE ratio.
- A more expensive valuation may be justified as CLS's earnings are expected to grow with 22.66% in the coming years.
Profitability Assessment of NYSE:CLS
Discover ChartMill's exclusive Profitability Rating, a proprietary metric that assesses stocks on a scale of 0 to 10. It takes into consideration various profitability ratios and margins, both in absolute terms and relative to industry peers. Notably, NYSE:CLS has achieved a 8:
- Looking at the Return On Assets, with a value of 6.22%, CLS is in the better half of the industry, outperforming 79.37% of the companies in the same industry.
- With an excellent Return On Equity value of 20.28%, CLS belongs to the best of the industry, outperforming 92.06% of the companies in the same industry.
- CLS's Return On Invested Capital of 13.13% is amongst the best of the industry. CLS outperforms 89.68% of its industry peers.
- The last Return On Invested Capital (13.13%) for CLS is above the 3 year average (8.21%), which is a sign of increasing profitability.
- Looking at the Profit Margin, with a value of 4.16%, CLS is in the better half of the industry, outperforming 67.46% of the companies in the same industry.
- In the last couple of years the Profit Margin of CLS has grown nicely.
- CLS has a Operating Margin of 5.68%. This is in the better half of the industry: CLS outperforms 69.05% of its industry peers.
- CLS's Operating Margin has improved in the last couple of years.
- In the last couple of years the Gross Margin of CLS has grown nicely.
Evaluating Health: NYSE:CLS
ChartMill utilizes a Health Rating to assess stocks, scoring them on a scale of 0 to 10. This rating takes into account a variety of liquidity and solvency ratios, both in absolute terms and in comparison to industry peers. NYSE:CLS has earned a 5 out of 10:
- The Debt to FCF ratio of CLS is 2.77, which is a good value as it means it would take CLS, 2.77 years of fcf income to pay off all of its debts.
- CLS's Debt to FCF ratio of 2.77 is fine compared to the rest of the industry. CLS outperforms 68.25% of its industry peers.
- CLS has a Debt/Equity ratio of 0.49. This is a healthy value indicating a solid balance between debt and equity.
Growth Analysis for NYSE:CLS
ChartMill assigns a proprietary Growth Rating to each stock. The score is computed by evaluating various growth aspects, like EPS and revenue growth. We take into account the history as well as the estimated future numbers. NYSE:CLS was assigned a score of 7 for growth:
- CLS shows a strong growth in Earnings Per Share. In the last year, the EPS has been growing by 51.43%, which is quite impressive.
- CLS shows quite a strong growth in Earnings Per Share. Measured over the last years, the EPS has been growing by 17.61% yearly.
- Looking at the last year, CLS shows a quite strong growth in Revenue. The Revenue has grown by 13.45% in the last year.
- CLS is expected to show a strong growth in Earnings Per Share. In the coming years, the EPS will grow by 22.66% yearly.
- Based on estimates for the next years, CLS will show a quite strong growth in Revenue. The Revenue will grow by 14.09% on average per year.
- The EPS growth rate is accelerating: in the next years the growth will be better than in the last years.
- When comparing the Revenue growth rate of the last years to the growth rate of the upcoming years, we see that the growth is accelerating.
More Decent Value stocks can be found in our Decent Value screener.
Check the latest full fundamental report of CLS for a complete fundamental analysis.
Disclaimer
This is not investing advice! The article highlights some of the observations at the time of writing, but you should always make your own analysis and invest based on your own insights.
80.56
-2.01 (-2.43%)
Find more stocks in the Stock Screener
CLS Latest News and Analysis
 6 days ago - ChartmillCELESTICA INC (NYSE:CLS) is showing good growth, while it is not too expensive.
Based on Fundamental Analysis it can be said that NYSE:CLS is a growth stock which is not overvalued.
