
CELESTICA INC (NYSE:CLS) was identified as a decent value stock by our stock screener. NYSE:CLS scores well on profitability, solvency and liquidity. At the same time it seems to be priced very reasonably. We'll explore this a bit deeper below.
Unpacking NYSE:CLS's Valuation Rating
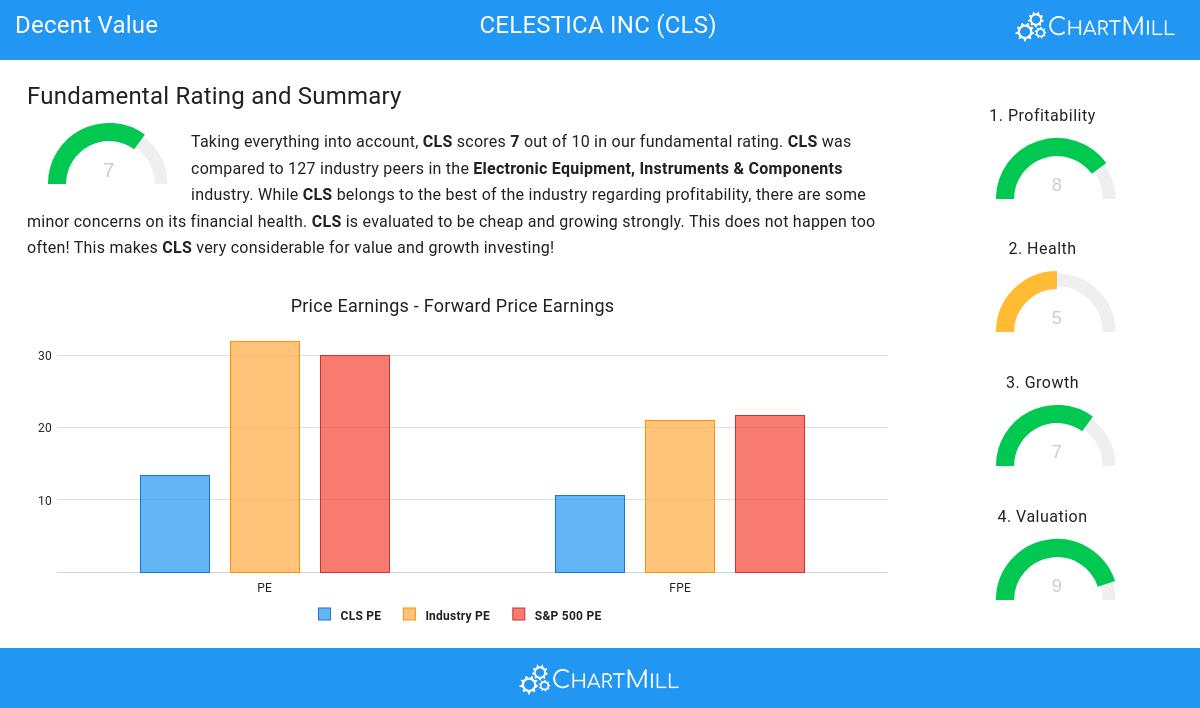
ChartMill assigns a Valuation Rating to each stock, ranging from 0 to 10. This rating is calculated by analyzing different valuation elements, such as price to earnings and free cash flow, both in absolute terms and relative to the market and industry. In the case of NYSE:CLS, the assigned 9 reflects its valuation:
- Based on the Price/Earnings ratio, CLS is valued cheaply inside the industry as 84.13% of the companies are valued more expensively.
- CLS is valuated cheaply when we compare the Price/Earnings ratio to 29.93, which is the current average of the S&P500 Index.
- CLS is valuated reasonably with a Price/Forward Earnings ratio of 10.53.
- Based on the Price/Forward Earnings ratio, CLS is valued cheaply inside the industry as 89.68% of the companies are valued more expensively.
- Compared to an average S&P500 Price/Forward Earnings ratio of 21.62, CLS is valued rather cheaply.
- 80.95% of the companies in the same industry are more expensive than CLS, based on the Enterprise Value to EBITDA ratio.
- Based on the Price/Free Cash Flow ratio, CLS is valued cheaper than 80.16% of the companies in the same industry.
- CLS's low PEG Ratio(NY), which compensates the Price/Earnings for growth, indicates a rather cheap valuation of the company.
- The excellent profitability rating of CLS may justify a higher PE ratio.
- A more expensive valuation may be justified as CLS's earnings are expected to grow with 22.66% in the coming years.
Evaluating Profitability: NYSE:CLS
ChartMill assigns a Profitability Rating to every stock. This score ranges from 0 to 10 and evaluates the different profitability ratios and margins, both absolutely, but also relative to the industry peers. NYSE:CLS scores a 8 out of 10:
- With a decent Return On Assets value of 6.22%, CLS is doing good in the industry, outperforming 79.37% of the companies in the same industry.
- CLS has a Return On Equity of 20.28%. This is amongst the best in the industry. CLS outperforms 92.06% of its industry peers.
- Looking at the Return On Invested Capital, with a value of 13.13%, CLS belongs to the top of the industry, outperforming 89.68% of the companies in the same industry.
- The last Return On Invested Capital (13.13%) for CLS is above the 3 year average (8.21%), which is a sign of increasing profitability.
- The Profit Margin of CLS (4.16%) is better than 67.46% of its industry peers.
- In the last couple of years the Profit Margin of CLS has grown nicely.
- CLS's Operating Margin of 5.68% is fine compared to the rest of the industry. CLS outperforms 68.25% of its industry peers.
- CLS's Operating Margin has improved in the last couple of years.
- CLS's Gross Margin has improved in the last couple of years.
How We Gauge Health for NYSE:CLS
A critical element of ChartMill's stock evaluation is the Health Rating, which spans from 0 to 10. This rating considers multiple health factors, including liquidity and solvency, both in absolute terms and relative to industry peers. NYSE:CLS has received a 5 out of 10:
- CLS has a debt to FCF ratio of 2.77. This is a good value and a sign of high solvency as CLS would need 2.77 years to pay back of all of its debts.
- CLS's Debt to FCF ratio of 2.77 is fine compared to the rest of the industry. CLS outperforms 68.25% of its industry peers.
- A Debt/Equity ratio of 0.49 indicates that CLS is not too dependend on debt financing.
Analyzing Growth Metrics
ChartMill assigns a Growth Rating to each stock, ranging from 0 to 10. This rating is determined by analyzing different growth elements, including EPS and revenue growth, spanning both historical and future figures. In the case of NYSE:CLS, the assigned 7 reflects its growth potential:
- CLS shows a strong growth in Earnings Per Share. In the last year, the EPS has been growing by 51.43%, which is quite impressive.
- CLS shows quite a strong growth in Earnings Per Share. Measured over the last years, the EPS has been growing by 17.61% yearly.
- CLS shows quite a strong growth in Revenue. In the last year, the Revenue has grown by 13.45%.
- Based on estimates for the next years, CLS will show a very strong growth in Earnings Per Share. The EPS will grow by 22.66% on average per year.
- The Revenue is expected to grow by 14.09% on average over the next years. This is quite good.
- The EPS growth rate is accelerating: in the next years the growth will be better than in the last years.
- The Revenue growth rate is accelerating: in the next years the growth will be better than in the last years.
More Decent Value stocks can be found in our Decent Value screener.
For an up to date full fundamental analysis you can check the fundamental report of CLS
Disclaimer
This is not investing advice! The article highlights some of the observations at the time of writing, but you should always make your own analysis and invest based on your own insights.