
THE CIGNA GROUP (NYSE:CI) Reveals Intriguing Technical Aspects. Here's What You Need to Know.
By Mill Chart
Last update: Mar 27, 2025
Our stock screener has identified THE CIGNA GROUP (NYSE:CI) as a potential breakout candidate. This technical breakout setup pattern occurs when the stock consolidates after a strong uptrend. While the actual breakout is uncertain, it may be worth keeping an eye on NYSE:CI.
What is the technical picture of CI telling us.
ChartMill utilizes a proprietary algorithm to assign a Technical Rating to every stock. This rating, ranging from 0 to 10, is computed daily by analyzing a variety of technical indicators and properties.
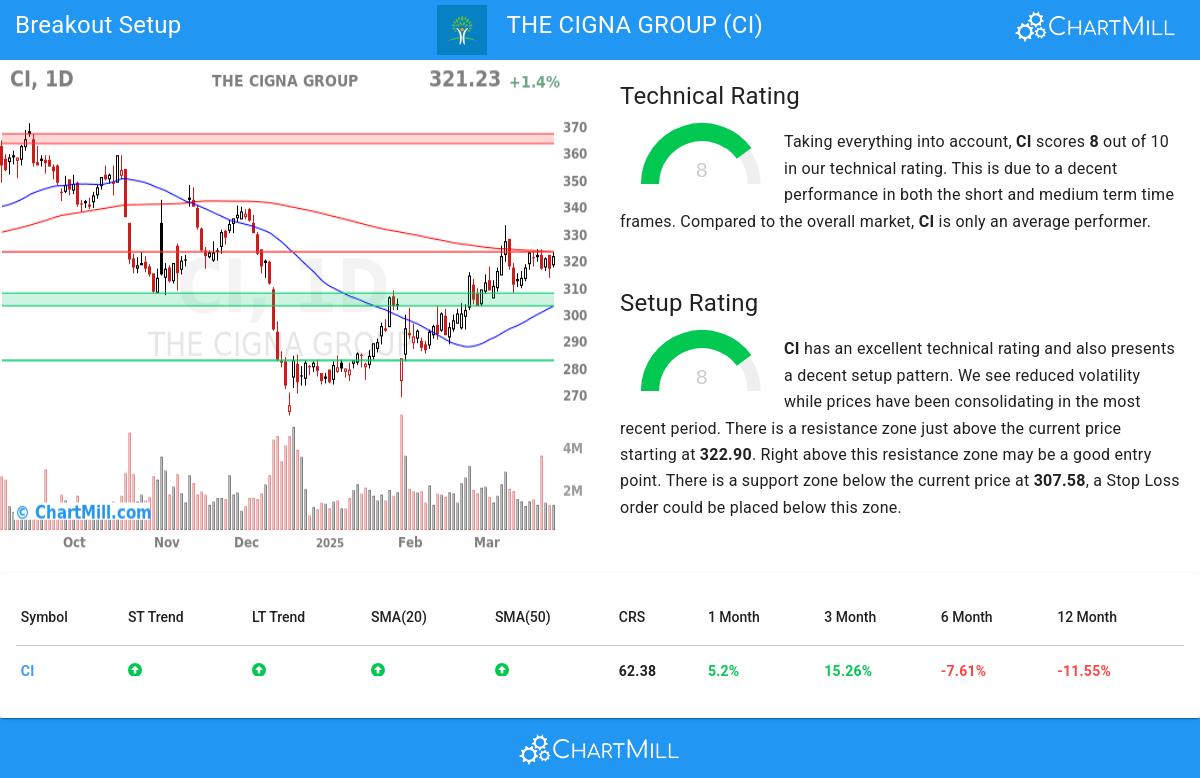
We assign a technical rating of 8 out of 10 to CI. This is due to a decent performance in both the short and medium term time frames. Compared to the overall market, CI is only an average performer.
- The long and short term trends are both positive. This is looking good!
- In the last month CI has a been trading in the 302.62 - 332.90 range, which is quite wide. It is currently trading in the middle of this range where prices have been consolidating recently, this may present a good entry opportunity, but some resistance may be present above.
- When comparing the performance of all stocks over the past year, CI turns out to be only a medium performer in the overall market: it outperformed 62% of all stocks.
- CI is an average performer in the Health Care Providers & Services industry, it outperforms 62% of 107 stocks in the same industry.
- CI is currently trading in the middle of its 52 week range. This is in line with the S&P500 Index, which is also trading in the middle of its range.
For an up to date full technical analysis you can check the technical report of CI
Looking at the Setup
Next to the Technical Rating, the Setup Rating of a stock determines to which extend the stock is consolidating. This score also ranges from 0 to 10 and is updated daily. The setup score evaluates various short term technical indicators. For CI this score is currently 8:
CI has an excellent technical rating and also presents a decent setup pattern. We see reduced volatility while prices have been consolidating in the most recent period. There is a resistance zone just above the current price starting at 322.90. Right above this resistance zone may be a good entry point. There is a support zone below the current price at 307.58, a Stop Loss order could be placed below this zone.
How can CI be traded?
A breakout could materialize when the stock breaks out to new highs above the current consolidation zone. One could wait for this to happen and buy when this happens. A stop loss could be placed below the consolidation zone.
Important Note: The content of this article is not intended as trading advice. It is essential to perform your own analysis and exercise caution when making trading decisions. The article presents technical observations generated by automated analysis but does not guarantee any trading outcomes. Always trade responsibly and make independent judgments.
Every day, new breakout setups can be found on ChartMill in our Breakout screener.
Disclaimer
This is not investing advice! The article highlights some of the observations at the time of writing, but you should always make your own analysis and invest based on your own insights.
330.13
+0.69 (+0.21%)
Find more stocks in the Stock Screener
CI Latest News and Analysis
 10 days ago - ChartmillTop S&P500 movers in Thursday's session
Let's have a look at what is happening on the US markets one hour before the close of the markets on Thursday. Below you can find the top S&P500 gainers and losers in today's session.
