
NYSE:CI is an undervalued gem with solid fundamentals.
By Mill Chart
Last update: Oct 28, 2024
Our stock screening tool has identified THE CIGNA GROUP (NYSE:CI) as an undervalued gem with strong fundamentals. NYSE:CI boasts decent financial health and profitability while maintaining an attractive price point. We'll break it down further.
Unpacking NYSE:CI's Valuation Rating
ChartMill employs its own Valuation Rating system for all stocks. This score, ranging from 0 to 10, is determined by evaluating different valuation factors, including price to earnings and free cash flow, both in absolute terms and relative to the market and industry. NYSE:CI has earned a 9 for valuation:
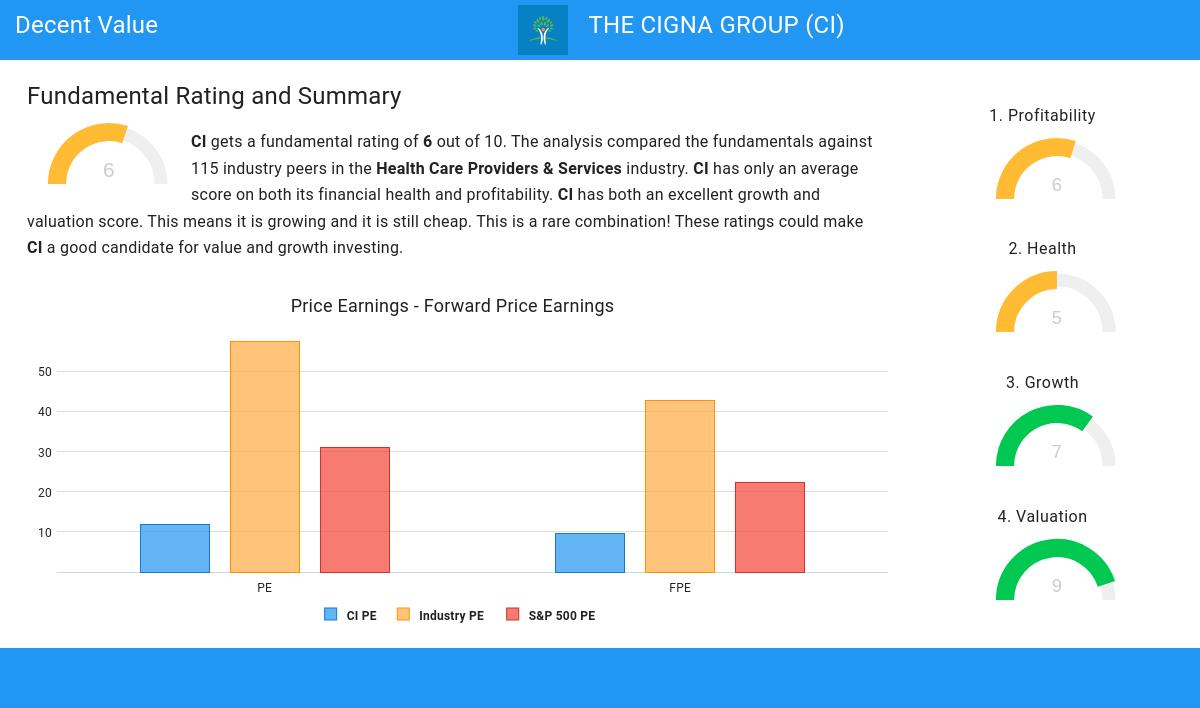
- With a Price/Earnings ratio of 11.84, the valuation of CI can be described as very reasonable.
- Compared to the rest of the industry, the Price/Earnings ratio of CI indicates a rather cheap valuation: CI is cheaper than 91.23% of the companies listed in the same industry.
- CI's Price/Earnings ratio indicates a rather cheap valuation when compared to the S&P500 average which is at 30.92.
- A Price/Forward Earnings ratio of 9.64 indicates a reasonable valuation of CI.
- 92.98% of the companies in the same industry are more expensive than CI, based on the Price/Forward Earnings ratio.
- When comparing the Price/Forward Earnings ratio of CI to the average of the S&P500 Index (22.41), we can say CI is valued rather cheaply.
- Based on the Enterprise Value to EBITDA ratio, CI is valued cheaper than 84.21% of the companies in the same industry.
- Based on the Price/Free Cash Flow ratio, CI is valued cheaply inside the industry as 87.72% of the companies are valued more expensively.
- CI's low PEG Ratio(NY), which compensates the Price/Earnings for growth, indicates a rather cheap valuation of the company.
- The decent profitability rating of CI may justify a higher PE ratio.
- CI's earnings are expected to grow with 13.72% in the coming years. This may justify a more expensive valuation.
Profitability Assessment of NYSE:CI
ChartMill employs its own Profitability Rating system for stock evaluation. This score, ranging from 0 to 10, is derived from an analysis of diverse profitability metrics and margins. In the case of NYSE:CI, the assigned 6 is noteworthy for profitability:
- CI's Return On Assets of 2.39% is fine compared to the rest of the industry. CI outperforms 67.54% of its industry peers.
- CI's Return On Equity of 8.97% is fine compared to the rest of the industry. CI outperforms 74.56% of its industry peers.
- CI has a Return On Invested Capital of 8.45%. This is amongst the best in the industry. CI outperforms 84.21% of its industry peers.
- The last Return On Invested Capital (8.45%) for CI is above the 3 year average (7.18%), which is a sign of increasing profitability.
- CI's Profit Margin of 1.70% is fine compared to the rest of the industry. CI outperforms 68.42% of its industry peers.
- With a decent Operating Margin value of 4.39%, CI is doing good in the industry, outperforming 62.28% of the companies in the same industry.
Evaluating Health: NYSE:CI
ChartMill employs a unique Health Rating system for all stocks. This rating, ranging from 0 to 10, is determined by analyzing various liquidity and solvency ratios. For NYSE:CI, the assigned 5 for health provides valuable insights:
- The Altman-Z score of CI (2.38) is better than 62.28% of its industry peers.
- CI has a better Debt to FCF ratio (4.01) than 81.58% of its industry peers.
How do we evaluate the Growth for NYSE:CI?
ChartMill assigns a proprietary Growth Rating to each stock. The score is computed by evaluating various growth aspects, like EPS and revenue growth. We take into account the history as well as the estimated future numbers. NYSE:CI was assigned a score of 7 for growth:
- The Earnings Per Share has grown by an nice 18.68% over the past year.
- CI shows quite a strong growth in Earnings Per Share. Measured over the last years, the EPS has been growing by 11.91% yearly.
- Looking at the last year, CI shows a quite strong growth in Revenue. The Revenue has grown by 17.09% in the last year.
- Measured over the past years, CI shows a very strong growth in Revenue. The Revenue has been growing by 32.15% on average per year.
- CI is expected to show quite a strong growth in Earnings Per Share. In the coming years, the EPS will grow by 12.60% yearly.
- Based on estimates for the next years, CI will show a quite strong growth in Revenue. The Revenue will grow by 9.87% on average per year.
More Decent Value stocks can be found in our Decent Value screener.
Check the latest full fundamental report of CI for a complete fundamental analysis.
Keep in mind
Important Note: The content of this article is not intended as trading advice. It is essential to perform your own analysis and exercise caution when making trading decisions. The article presents observations created by automated analysis but does not guarantee any trading or investment outcomes. Always trade responsibly and make independent judgments.
335.7
-0.99 (-0.29%)
Find more stocks in the Stock Screener
CI Latest News and Analysis
 14 days ago - ChartmillTop S&P500 movers in Thursday's session
Let's have a look at what is happening on the US markets one hour before the close of the markets on Thursday. Below you can find the top S&P500 gainers and losers in today's session.
