
Take a closer look at THE CIGNA GROUP (NYSE:CI), an affordable growth stock uncovered by our stock screener. NYSE:CI boasts strong growth prospects and excels in financial health indicators, all while maintaining a reasonable valuation. Let's break it down further.
Growth Assessment of NYSE:CI
A key component of ChartMill's stock assessment is the Growth Rating, which spans from 0 to 10. This rating evaluates diverse growth factors, such as EPS and revenue growth, considering both past performance and future projections. NYSE:CI has received a 7 out of 10:
- The Earnings Per Share has grown by an nice 18.68% over the past year.
- CI shows quite a strong growth in Earnings Per Share. Measured over the last years, the EPS has been growing by 11.91% yearly.
- CI shows quite a strong growth in Revenue. In the last year, the Revenue has grown by 17.09%.
- The Revenue has been growing by 32.15% on average over the past years. This is a very strong growth!
- The Earnings Per Share is expected to grow by 12.60% on average over the next years. This is quite good.
- Based on estimates for the next years, CI will show a quite strong growth in Revenue. The Revenue will grow by 9.87% on average per year.
Evaluating Valuation: NYSE:CI
To assess a stock's valuation, ChartMill utilizes a Valuation Rating on a scale of 0 to 10. This comprehensive assessment considers various valuation aspects, comparing price to earnings and cash flows, while factoring in profitability and growth. NYSE:CI has achieved a 8 out of 10:
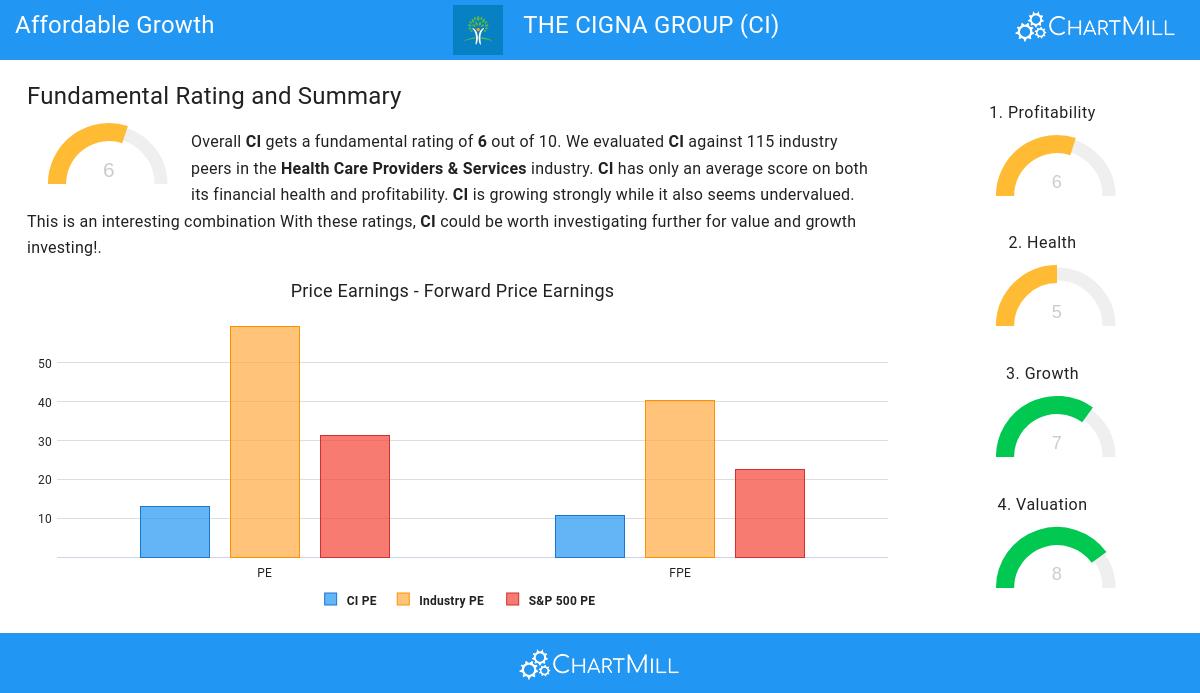
- 90.35% of the companies in the same industry are more expensive than CI, based on the Price/Earnings ratio.
- CI's Price/Earnings ratio indicates a rather cheap valuation when compared to the S&P500 average which is at 31.19.
- With a Price/Forward Earnings ratio of 10.58, the valuation of CI can be described as very reasonable.
- Based on the Price/Forward Earnings ratio, CI is valued cheaply inside the industry as 92.98% of the companies are valued more expensively.
- When comparing the Price/Forward Earnings ratio of CI to the average of the S&P500 Index (22.50), we can say CI is valued rather cheaply.
- Based on the Enterprise Value to EBITDA ratio, CI is valued cheaper than 81.58% of the companies in the same industry.
- Based on the Price/Free Cash Flow ratio, CI is valued cheaper than 86.84% of the companies in the same industry.
- The low PEG Ratio(NY), which compensates the Price/Earnings for growth, indicates a rather cheap valuation of the company.
- The decent profitability rating of CI may justify a higher PE ratio.
- CI's earnings are expected to grow with 13.72% in the coming years. This may justify a more expensive valuation.
Health Assessment of NYSE:CI
ChartMill assigns a proprietary Health Rating to each stock. The score is computed by evaluating various liquidity and solvency ratios and ranges from 0 to 10. NYSE:CI was assigned a score of 5 for health:
- CI's Altman-Z score of 2.42 is fine compared to the rest of the industry. CI outperforms 60.53% of its industry peers.
- With an excellent Debt to FCF ratio value of 4.01, CI belongs to the best of the industry, outperforming 81.58% of the companies in the same industry.
Assessing Profitability for NYSE:CI
ChartMill assigns a proprietary Profitability Rating to each stock. The score is computed by evaluating various profitability ratios and margins and ranges from 0 to 10. NYSE:CI was assigned a score of 6 for profitability:
- Looking at the Return On Assets, with a value of 2.39%, CI is in the better half of the industry, outperforming 66.67% of the companies in the same industry.
- With a decent Return On Equity value of 8.97%, CI is doing good in the industry, outperforming 74.56% of the companies in the same industry.
- CI has a Return On Invested Capital of 8.45%. This is amongst the best in the industry. CI outperforms 83.33% of its industry peers.
- The last Return On Invested Capital (8.45%) for CI is above the 3 year average (7.18%), which is a sign of increasing profitability.
- CI's Profit Margin of 1.70% is fine compared to the rest of the industry. CI outperforms 68.42% of its industry peers.
- CI's Operating Margin of 4.39% is fine compared to the rest of the industry. CI outperforms 62.28% of its industry peers.
Every day, new Affordable Growth stocks can be found on ChartMill in our Affordable Growth screener.
Our latest full fundamental report of CI contains the most current fundamental analsysis.
Keep in mind
This article should in no way be interpreted as advice. The article is based on the observed metrics at the time of writing, but you should always make your own analysis and trade or invest at your own responsibility.