
Is CBRE GROUP INC - A Ready to Break Out of Its Range?
By Mill Chart
Last update: Oct 17, 2024
Our stockscreener has identified a possible breakout setup on CBRE GROUP INC - A (NYSE:CBRE). This occurs when the stock consolidates following a significant upward movement. While the breakout outcome cannot be guaranteed, it may be worth monitoring NYSE:CBRE for potential opportunities.
In-Depth Technical Analysis of NYSE:CBRE
ChartMill utilizes a proprietary algorithm to assign a Technical Rating to every stock. This rating, ranging from 0 to 10, is computed daily by analyzing a variety of technical indicators and properties.
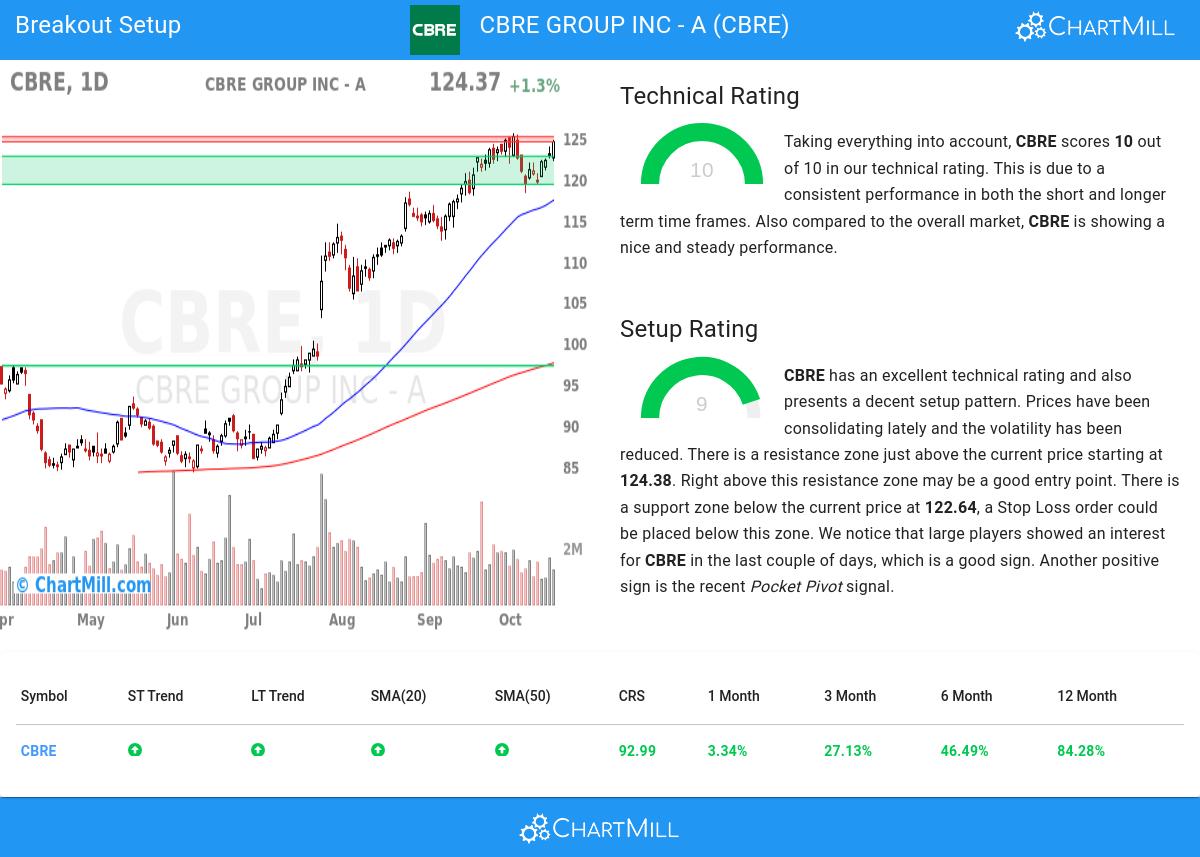
Taking everything into account, CBRE scores 10 out of 10 in our technical rating. Both in the recent history as in the last year, CBRE has proven to be a steady performer, scoring decent points in every aspect analyzed.
- Both the short term and long term trends are positive. This is a very positive sign.
- When comparing the yearly performance of all stocks, we notice that CBRE is one of the better performing stocks in the market, outperforming 92% of all stocks. We also observe that the gains produced by CBRE over the past year are nicely spread over this period.
- CBRE is part of the Real Estate Management & Development industry. There are 68 other stocks in this industry. CBRE outperforms 91% of them.
- CBRE is currently trading near its 52 week high, which is a good sign. The S&P500 Index however is also trading near new highs, which makes the performance in line with the market.
- In the last month CBRE has a been trading in the 118.24 - 125.43 range, which is quite wide. It is currently trading near the high of this range.
Check the latest full technical report of CBRE for a complete technical analysis.
Looking at the Setup
In addition to the Technical Rating, ChartMill provides a Setup Rating for each stock. This rating, ranging from 0 to 10, assesses the level of consolidation in the stock based on multiple short-term technical indicators. Currently, NYSE:CBRE has a 9 as its setup rating, indicating its current consolidation status.
Besides having an excellent technical rating, CBRE also presents a decent setup pattern. Prices have been consolidating lately and the volatility has been reduced. There is a resistance zone just above the current price starting at 124.38. Right above this resistance zone may be a good entry point. There is a support zone below the current price at 122.64, a Stop Loss order could be placed below this zone. We notice that large players showed an interest for CBRE in the last couple of days, which is a good sign. Another positive sign is the recent Pocket Pivot signal.
Trading setups like NYSE:CBRE
To potentially initiate a trade, it is common practice to wait for the stock to break out of the consolidation zone. This breakout signifies a potential upward movement, and traders may enter the stock at that point. Conversely, if the stock falls back below the consolidation zone, it may be sold at a loss.
Of course, there are many ways to trade or not trade NYSE:CBRE and this article should in no way be interpreted as trading advice. The article is purely based on an automated technical analysis and just points out the technical observations. Always make your own analysis and trade at your own responsibility.
Every day, new breakout setups can be found on ChartMill in our Breakout screener.
Disclaimer
This article should in no way be interpreted as advice. The article is based on the observed metrics at the time of writing, but you should always make your own analysis and trade or invest at your own responsibility.
117.62
+0.41 (+0.35%)
Find more stocks in the Stock Screener
CBRE Latest News and Analysis
 9 days ago - ChartmillWhat's going on in today's session: S&P500 movers
Stay informed about the performance of the S&P500 index in the middle of the day on Wednesday. Uncover the top gainers and losers in today's session for valuable insights.
 9 days ago - ChartmillThese S&P500 stocks are gapping in today's session
Let's have a look at the S&P500 gap up and gap down stocks in today's session.
