
Delving into CAL-MAINE FOODS INC (NASDAQ:CALM)'s high Growth Prospects.
By Mill Chart
Last update: Mar 27, 2025
A possible breakout setup was detected on CAL-MAINE FOODS INC (NASDAQ:CALM) by our stockscreener. A breakout pattern is formed when a stock consolidates after a strong rise up. We note that this pattern is detected purely based on technical analysis and whether the breakout actually materializes remains to be seen. It could be interesting to keep an eye on NASDAQ:CALM.
Deciphering the Technical Picture of CALM
At ChartMill, a crucial aspect of their analysis is the assignment of a Technical Rating to each stock. This rating, ranging from 0 to 10, is calculated daily by considering numerous technical indicators and properties.
Overall CALM gets a technical rating of 7 out of 10. Although CALM has been one of the better performers in the overall market, we have a mixed picture in the medium term time frame. But recently some decent action can be observed again.
- The short term trend is positive, while the long term trend is neutral. So this is evolving in the right direction.
- Looking at the yearly performance, CALM did better than 92% of all other stocks. We also observe that the gains produced by CALM over the past year are nicely spread over this period.
- CALM is one of the better performing stocks in the Food Products industry, it outperforms 91% of 91 stocks in the same industry.
- In the last month CALM has a been trading in the 79.55 - 94.15 range, which is quite wide. It is currently trading near the high of this range.
- CALM is currently trading in the middle of its 52 week range. This is in line with the S&P500 Index, which is also trading in the middle of its range.
Our latest full technical report of CALM contains the most current technical analsysis.
How do we evaluate the setup for CALM?
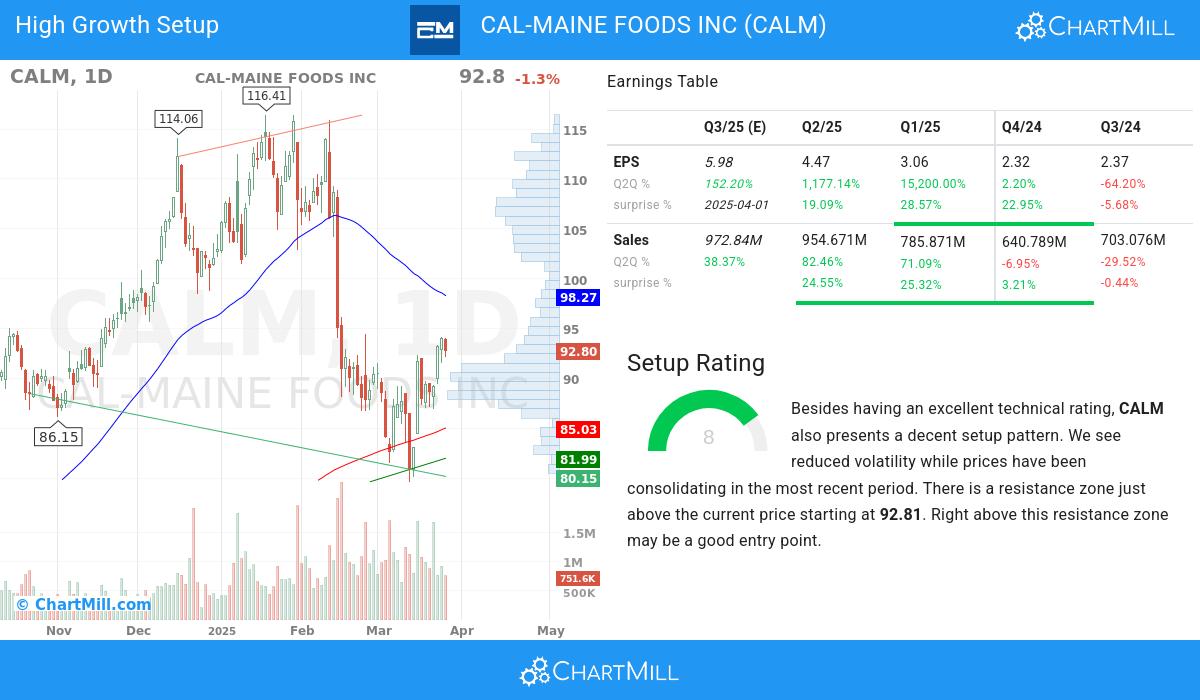
ChartMill takes into account not only the Technical Rating but also assigns a Setup Rating to each stock. This rating, on a scale of 0 to 10, reflects the degree of consolidation observed based on short-term technical indicators. Currently, CALM exhibits a 8 setup rating, indicating its consolidation status in recent days and weeks.
Besides having an excellent technical rating, CALM also presents a decent setup pattern. Prices have been consolidating lately and the volatility has been reduced. There is a resistance zone just above the current price starting at 92.81. Right above this resistance zone may be a good entry point.
High Growth Analysis for CALM
ChartMill employs its own High Growth Momentum Rating (HGM) system for all stocks. This score, ranging from 0 to 10, is derived by evaluating different growth and profitability factors, such as EPS and revenue growth, as well as accelleration, surprises and revision history. CALM has earned a 6:
Explosive Earnings Growth
- The earnings per share (EPS) of CALM have shown positive growth on a quarter-to-quarter (Q2Q) basis, with a 1.0K% increase. This reflects the company's ability to improve its profitability over time.
- Over the past year, CALM has demonstrated 31.97% growth in EPS, signifying its positive financial trajectory and potential for future profitability.
- Over the past 3 years, CALM has demonstrated 402.0% growth in EPS, signifying its positive financial trajectory and potential for future profitability.
- CALM has demonstrated strong quarter-to-quarter (Q2Q) revenue growth of 82.46%, reflecting its ability to generate consistent increases in sales. This growth highlights the company's effective market positioning and its potential for continued success.
- CALM shows accelerating Sales growth: when comparing the current Q2Q growth of 82.46% to the previous quarter Q2Q growth of 71.1%, we see the growth rate improving.
- Sales growth accelerated for 3 quarters in a row.
- The average next Quarter EPS Estimate for CALM has experienced a 296.0% change in the last 3 months, reflecting evolving expectations by analysts regarding the company's EPS performance.
- CALM has a strong history of beating EPS estimates 3 times in the last 4 quarters, signaling its ability to consistently exceed market expectations. This indicates the company's strong financial performance and its potential for creating shareholder value.
Profitability & Financial Strength
- With positive growth in its operating margin over the past year, CALM showcases its ability to improve profitability through effective cost control and operational efficiency. This growth underscores the company's commitment to enhancing its financial performance.
- The free cash flow (FCF) of CALM has seen steady growth over the past year, indicating enhanced cash flow generation and financial health. This trend underscores the company's effective capital management and its ability to generate sustainable cash flows.
- The Return on Equity(ROE) of CALM is 30.75%, which is a strong number. This indicates the company's ability to generate favorable returns for shareholders and reflects its effective management of resources.
- With a Debt/Equity ratio of 0.0, CALM appears to have a manageable debt load relative to its assets.
Market Strength & Institutional Confidence
- The ownership composition of CALM reflects a balanced investor ecosystem, with institutional shareholders owning 91.92%. This indicates a broader market participation and potential for increased trading liquidity.
- The Relative Strength (RS) of CALM has consistently been strong, with a current 92.04 rating. This indicates the stock's ability to exhibit relative price outperformance and reflects its competitive strength.
Our High Growth Momentum Breakout screen will find you more ideas suited for high growth momentum breakouts.
Keep in mind
This is not investing advice! The article highlights some of the observations at the time of writing, but you should always make your own analysis and invest based on your own insights.
91.49
-1.01 (-1.09%)
Find more stocks in the Stock Screener
CALM Latest News and Analysis
 5 days ago - ChartmillHow does CAL-MAINE FOODS INC (NASDAQ:CALM) stack up against Mark Minervini’s strategy?
A fundamental and technical analysis of (NASDAQ:CALM): Why the high growth investor may take a look at CAL-MAINE FOODS INC (NASDAQ:CALM).
 8 days ago - ChartmillWhy CAL-MAINE FOODS INC (NASDAQ:CALM) qualifies as a high growth stock.
A fundamental analysis of (NASDAQ:CALM): Why CAL-MAINE FOODS INC (NASDAQ:CALM) qualifies as a high growth stock.
 17 days ago - ChartmillCAL-MAINE FOODS INC (NASDAQ:CALM): good value for what you're paying.
Consider CAL-MAINE FOODS INC as a top value stock. NASDAQ:CALM shines in terms of profitability, solvency, and liquidity, all while remaining very reasonably priced.
