
Exploring BYRNA TECHNOLOGIES INC (NASDAQ:BYRN)'s high growth characteristics.
By Mill Chart
Last update: Feb 27, 2025
BYRNA TECHNOLOGIES INC (NASDAQ:BYRN) has been identified as a Technical Breakout Setup Pattern by our stock screener. This pattern typically occurs when a stock takes a pause after a significant rise, indicating the possibility of a continuation in the trend. While it's impossible to predict with certainty, it might be beneficial to monitor NASDAQ:BYRN.
In-Depth Technical Analysis of NASDAQ:BYRN
As part of its analysis, ChartMill provides a comprehensive Technical Rating for each stock. This rating, ranging from 0 to 10, is updated on a daily basis and is based on the evaluation of various technical indicators and properties.
Overall BYRN gets a technical rating of 8 out of 10. This is due to a consistent overall performance, although we see some doubts in the very recent evolution. In the medium time frame things are still looking good.
- Looking at the yearly performance, BYRN did better than 97% of all other stocks. We also observe that the gains produced by BYRN over the past year are nicely spread over this period.
- BYRN is one of the better performing stocks in the Aerospace & Defense industry, it outperforms 93% of 65 stocks in the same industry.
- BYRN is currently trading in the upper part of its 52 week range. The S&P500 Index is also trading in the upper part of its 52 week range, so BYRN is performing more or less in line with the market.
- The short term trend is negative, but the long term trend is still positive. So although the long term is still positive, this may be a trend turning.
For an up to date full technical analysis you can check the technical report of BYRN
Why is NASDAQ:BYRN a setup?
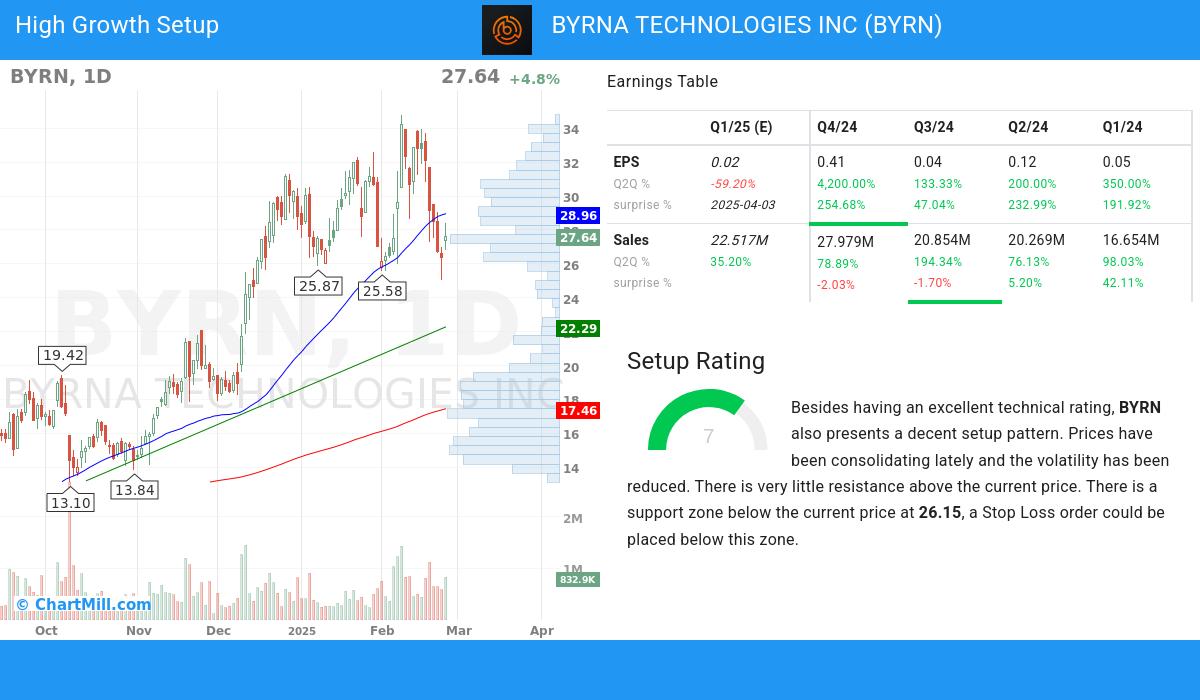
ChartMill also assign a Setup Rating to every stock. With this score it is determined to what extend the stock has been trading in a range in the recent days and weeks. This score also ranges from 0 to 10 and is updated daily. The setup score evaluates various short term technical indicators. NASDAQ:BYRN scores a 7 out of 10:
BYRN has an excellent technical rating and also presents a decent setup pattern. Prices have been consolidating lately and the volatility has been reduced. There is very little resistance above the current price. There is a support zone below the current price at 26.15, a Stop Loss order could be placed below this zone.
Some of the high growth metrics of NASDAQ:BYRN highlighted
- The recent financial report of BYRNA TECHNOLOGIES INC demonstrates a 4.0K% increase in quarterly earnings compared to the previous quarter. This growth indicates positive momentum in the company's financials and suggests a promising upward trend
- BYRNA TECHNOLOGIES INC has achieved 78.89% growth in its revenue over the previous quarter, signaling positive momentum in its financial performance and potential market opportunities.
- With notable 1-year revenue growth of 101.0%, BYRNA TECHNOLOGIES INC exemplifies its ability to generate increased sales and revenue streams. This growth signifies the company's strong business performance and its potential for future growth.
- In the most recent financial report, BYRNA TECHNOLOGIES INC reported a 4.0K% increase in quarterly earnings compared to the previous quarter. This notable growth indicates positive momentum in the company's financials, suggesting an upward trend
- accelerating EPS growth for BYRNA TECHNOLOGIES INC: the current Q2Q growth of 4.0K% exceeds the previous year Q2Q growth of -117.0%.
- With positive growth in its operating margin over the past year, BYRNA TECHNOLOGIES INC showcases its ability to improve profitability through effective cost control and operational efficiency. This growth underscores the company's commitment to enhancing its financial performance.
- With a favorable trend in its free cash flow (FCF) over the past year, BYRNA TECHNOLOGIES INC demonstrates its ability to generate robust cash flows and maintain financial stability. This growth reflects the company's focus on efficient capital allocation and cash management.
- BYRNA TECHNOLOGIES INC has a healthy Return on Equity(ROE) of 23.53%. This demonstrates the company's efficient utilization of capital and indicates its commitment to driving profitability.
- BYRNA TECHNOLOGIES INC exhibits a favorable Debt-to-Equity ratio at 0.0. This highlights the company's ability to limit excessive debt levels and maintain a strong equity base, demonstrating its financial stability and risk management practices.
- BYRNA TECHNOLOGIES INC demonstrates a balanced ownership structure, with institutional shareholders at 52.81%. This indicates a diverse investor base, which can contribute to price stability and potential future growth.
- BYRNA TECHNOLOGIES INC has consistently surpassed EPS estimates in the last 4 quarters, reflecting its strong financial performance and effective management. This trend suggests the company's ability to generate positive earnings surprises and drive shareholder value.
- BYRNA TECHNOLOGIES INC has achieved an impressive Relative Strength (RS) rating of 97.49, showcasing its ability to outperform the broader market. This strong performance positions BYRNA TECHNOLOGIES INC as an attractive stock for potential price appreciation.
More high growth momentum breakout stocks can be found in our High Growth Momentum Breakout screen.
Disclaimer
Important Note: The content of this article is not intended as trading advice. It is essential to perform your own analysis and exercise caution when making trading decisions. The article presents observations created by automated analysis but does not guarantee any trading or investment outcomes. Always trade responsibly and make independent judgments.
