
Why the high growth investor may take a look at BOSTON SCIENTIFIC CORP (NYSE:BSX).
By Mill Chart
Last update: Mar 5, 2025
Our stock screener has spotted BOSTON SCIENTIFIC CORP (NYSE:BSX) as a possible breakout candidate. A technical breakout setup pattern occurs when the stock is consolidating after a nice uptrend. Whether the actual breakout occurs remains to be seen of course, but it may be interesting to keep an eye on NYSE:BSX.
Analyzing the Technical Aspects
ChartMill employs a sophisticated system to assign a Technical Rating to every stock in its analysis. This rating, which ranges from 0 to 10, is determined by carefully assessing multiple technical indicators and properties.
We assign a technical rating of 10 out of 10 to BSX. This is due to a consistent performance in both the short and longer term time frames. Also compared to the overall market, BSX is showing a nice and steady performance.
- The long and short term trends are both positive. This is looking good!
- When comparing the yearly performance of all stocks, we notice that BSX is one of the better performing stocks in the market, outperforming 94% of all stocks. We also observe that the gains produced by BSX over the past year are nicely spread over this period.
- BSX is one of the better performing stocks in the Health Care Equipment & Supplies industry, it outperforms 89% of 188 stocks in the same industry.
- BSX is currently trading near its 52 week high, which is a good sign. The S&P500 Index is trading in the upper part of its 52 week range, but not near new highs, so BSX is leading the market.
- In the last month BSX has a been trading in the 97.08 - 107.17 range, which is quite wide. It is currently trading in the middle of this range where prices have been consolidating recently, this may present a good entry opportunity, but some resistance may be present above.
For an up to date full technical analysis you can check the technical report of BSX
Why is NYSE:BSX a setup?
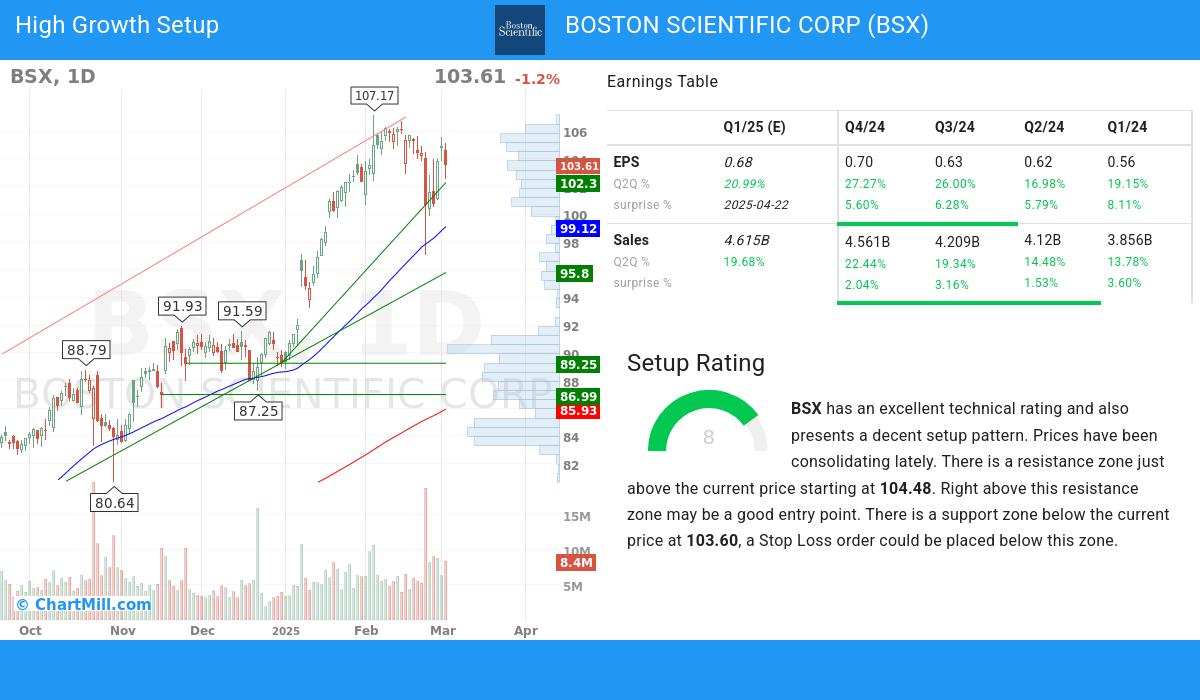
Besides the Technical Rating, ChartMill assigns a Setup Rating to every stock to determine the degree of consolidation. This rating, ranging from 0 to 10, is updated daily and evaluates various short-term technical indicators. NYSE:BSX currently holds a 8 as its setup rating, suggesting a particular level of consolidation in the stock.
Besides having an excellent technical rating, BSX also presents a decent setup pattern. Prices have been consolidating lately. There is a resistance zone just above the current price starting at 104.48. Right above this resistance zone may be a good entry point. There is a support zone below the current price at 103.60, a Stop Loss order could be placed below this zone.
Looking into the high growth metrics of BOSTON SCIENTIFIC CORP
- The earnings per share (EPS) of BOSTON SCIENTIFIC CORP have shown positive growth on a quarter-to-quarter (Q2Q) basis, with a 27.27% increase. This reflects the company's ability to improve its profitability over time.
- With impressive quarter-to-quarter (Q2Q) revenue growth of 22.44%, BOSTON SCIENTIFIC CORP showcases its ability to generate increased sales and revenue. This growth indicates the company's strong customer demand and its effective business strategies.
- The average next Quarter EPS Estimate by analysts was adjusted by 4.67%, reflecting the evolving market expectations for the company's EPS growth.
- The quarterly earnings of BOSTON SCIENTIFIC CORP have shown a 27.27% increase compared to the previous quarter, as revealed in the recent financial report. This growth signifies positive momentum in the company's financials, pointing towards a promising upward trend
- accelerating EPS growth for BOSTON SCIENTIFIC CORP: the current Q2Q growth of 27.27% exceeds the previous year Q2Q growth of 12.24%.
- The operating margin of BOSTON SCIENTIFIC CORP has seen steady growth over the past year, signaling improved profitability. This trend indicates the company's effective cost management and its ability to generate higher returns.
- The free cash flow (FCF) of BOSTON SCIENTIFIC CORP has seen steady growth over the past year, indicating enhanced cash flow generation and financial health. This trend underscores the company's effective capital management and its ability to generate sustainable cash flows.
- BOSTON SCIENTIFIC CORP exhibits a favorable Debt-to-Equity ratio at 0.41. This highlights the company's ability to limit excessive debt levels and maintain a strong equity base, demonstrating its financial stability and risk management practices.
- With a track record of beating EPS estimates in the last 4 quarters, BOSTON SCIENTIFIC CORP showcases its consistent ability to deliver earnings surprises. This reflects the company's strong execution and its competitive position in the market.
- The Relative Strength (RS) of BOSTON SCIENTIFIC CORP has consistently been strong, with a current 94.26 rating. This indicates the stock's ability to exhibit relative price outperformance and reflects its competitive strength. BOSTON SCIENTIFIC CORP demonstrates promising potential for sustained price momentum.
More ideas for high growth momentum breakouts can be found on ChartMill in our High Growth Momentum Breakout screen.
Disclaimer
This is not investing advice! The article highlights some of the observations at the time of writing, but you should always make your own analysis and invest based on your own insights.
101.9
+0.76 (+0.75%)
Find more stocks in the Stock Screener
BSX Latest News and Analysis
 5 days ago - ChartmillWhat's going on in today's pre-market session: S&P500 movers
Stay updated with the S&P500 stocks that are on the move in today's pre-market session.
