
Is BOSTON SCIENTIFIC CORP Ready to Break Out of Its Range?
By Mill Chart
Last update: Oct 2, 2024
Our stock screener has identified BOSTON SCIENTIFIC CORP (NYSE:BSX) as a potential breakout candidate. This technical breakout setup pattern occurs when the stock consolidates after a strong uptrend. While the actual breakout is uncertain, it may be worth keeping an eye on NYSE:BSX.
Technical Analysis Observations
Every day ChartMill assigns a Technical Rating to every stock. The score ranges from 0 to 10 and is determined by evaluating multiple technical indicators and properties.
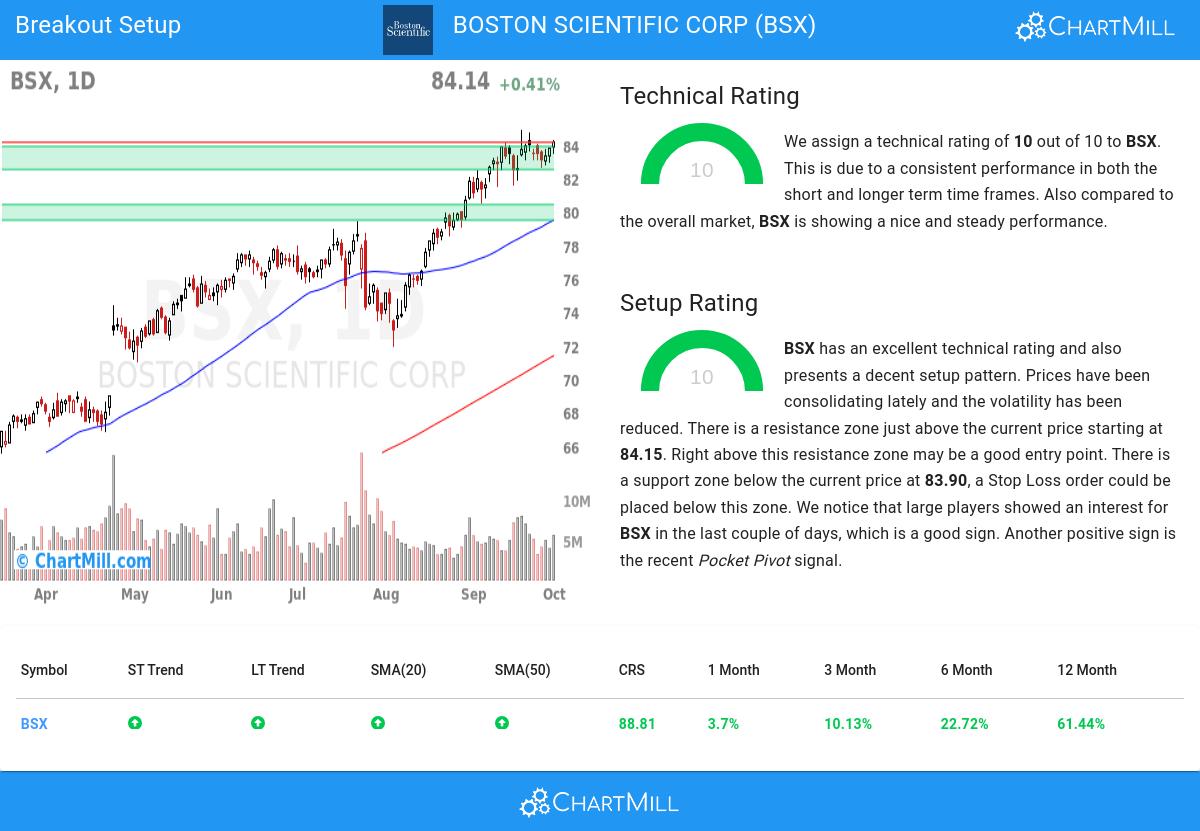
Taking everything into account, BSX scores 10 out of 10 in our technical rating. Both in the recent history as in the last year, BSX has proven to be a steady performer, scoring decent points in every aspect analyzed.
- Both the short term and long term trends are positive. This is a very positive sign.
- When comparing the yearly performance of all stocks, we notice that BSX is one of the better performing stocks in the market, outperforming 88% of all stocks. On top of that, BSX also shows a nice and consistent pattern of rising prices.
- BSX is one of the better performing stocks in the Health Care Equipment & Supplies industry, it outperforms 84% of 187 stocks in the same industry.
- BSX is currently trading near its 52 week high, which is a good sign. The S&P500 Index however is also trading near new highs, which makes the performance in line with the market.
- In the last month BSX has a been trading in a tight range between 80.50 and 84.89.
Our latest full technical report of BSX contains the most current technical analsysis.
Looking at the Setup
In addition to the Technical Rating, ChartMill provides a Setup Rating for each stock. This rating, ranging from 0 to 10, assesses the extent of consolidation in the stock based on multiple short-term technical indicators. Currently, NYSE:BSX has a 10 as its setup rating:
Besides having an excellent technical rating, BSX also presents a decent setup pattern. Prices have been consolidating lately and the volatility has been reduced. There is a resistance zone just above the current price starting at 84.15. Right above this resistance zone may be a good entry point. There is a support zone below the current price at 83.90, a Stop Loss order could be placed below this zone. We notice that large players showed an interest for BSX in the last couple of days, which is a good sign. Another positive sign is the recent Pocket Pivot signal.
How can NYSE:BSX be traded?
A breakout opportunity may arise when the stock surpasses the current consolidation zone and reaches new highs. Traders often wait for this breakout before considering buying the stock. To manage risk, a stop loss order could be placed below the consolidation zone to limit potential losses.
Disclaimer: This article is not intended to provide trading advice. It is crucial to conduct your own analysis and consider your own observations and trading style when making investment decisions. The article solely presents technical observations and should not be relied upon as a sole basis for trading.
Every day, new breakout setups can be found on ChartMill in our Breakout screener.
Keep in mind
This article should in no way be interpreted as advice. The article is based on the observed metrics at the time of writing, but you should always make your own analysis and trade or invest at your own responsibility.
95.12
-0.13 (-0.14%)
Find more stocks in the Stock Screener
BSX Latest News and Analysis
 16 days ago - ChartmillWhat's going on in today's session: S&P500 gap up and gap down stocks
Wondering what's happening in today's session regarding gap up and gap down stocks? Explore the S&P500 index on Wednesday to uncover the stocks that are gapping in the S&P500 index.
