
BERKSHIRE HATHAWAY INC-CL B is showing promising signs of setting up for a breakout.
By Mill Chart
Last update: Oct 14, 2024
Our stock screener has detected a potential breakout setup on BERKSHIRE HATHAWAY INC-CL B (NYSE:BRK.B). This breakout pattern is observed when a stock consolidates following a strong upward movement. It's important to note that this pattern is based on technical analysis, and the actual breakout outcome is uncertain. However, it might be worth keeping an eye on NYSE:BRK.B.
What is the technical picture of NYSE:BRK.B telling us.
ChartMill utilizes a proprietary algorithm to assign a Technical Rating to every stock. This rating, ranging from 0 to 10, is computed daily by analyzing a variety of technical indicators and properties.
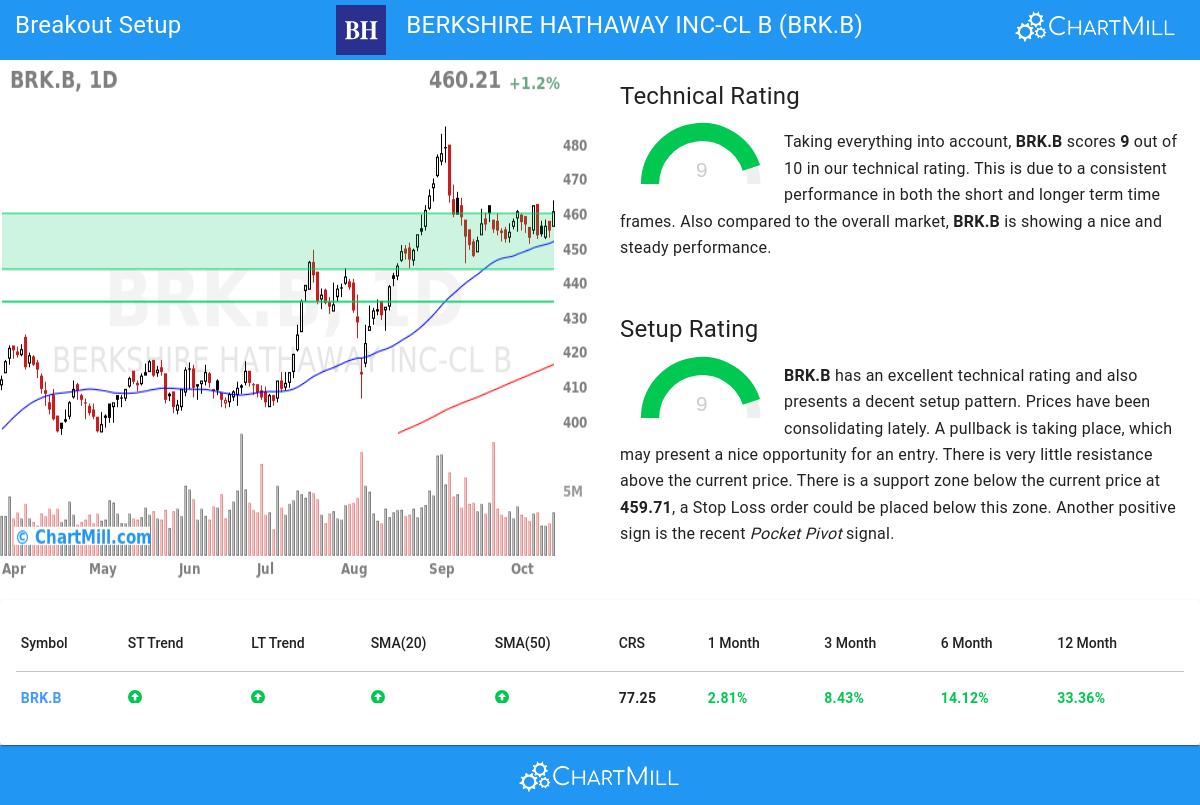
We assign a technical rating of 9 out of 10 to BRK.B. This is due to a consistent performance in both the short and longer term time frames. Also compared to the overall market, BRK.B is showing a nice and steady performance.
- Both the short term and long term trends are positive. This is a very positive sign.
- When comparing the yearly performance of all stocks, we notice that BRK.B is one of the better performing stocks in the market, outperforming 77% of all stocks. On top of that, BRK.B also shows a nice and consistent pattern of rising prices.
- BRK.B is currently trading in the upper part of its 52 week range. The S&P500 Index however is currently trading near a new high, so BRK.B is lagging the market slightly.
- BRK.B is part of the Financial Services industry. There are 101 other stocks in this industry, BRK.B did better than 63% of them.
- In the last month BRK.B has a been trading in a tight range between 448.34 and 463.45.
Our latest full technical report of BRK.B contains the most current technical analsysis.
How does the Setup look for NYSE:BRK.B
ChartMill also assign a Setup Rating to every stock. With this score it is determined to what extend the stock has been trading in a range in the recent days and weeks. This score also ranges from 0 to 10 and is updated daily. The setup score evaluates various short term technical indicators. NYSE:BRK.B scores a 9 out of 10:
Besides having an excellent technical rating, BRK.B also presents a decent setup pattern. Prices have been consolidating lately. A pullback is taking place, which may present a nice opportunity for an entry. There is very little resistance above the current price. There is a support zone below the current price at 459.71, a Stop Loss order could be placed below this zone. Very recently a Pocket Pivot signal was observed. This is another positive sign.
How can NYSE:BRK.B be traded?
To potentially initiate a trade, it is common practice to wait for the stock to break out of the consolidation zone. This breakout signifies a potential upward movement, and traders may enter the stock at that point. Conversely, if the stock falls back below the consolidation zone, it may be sold at a loss.
Please note that this article should not be construed as trading advice. The information provided is solely based on automated technical analysis and serves to highlight technical observations. It is important to conduct your own analysis and make trading decisions based on your own judgment and responsibility.
Our Breakout screener lists more breakout setups and is updated daily.
Disclaimer
This article should in no way be interpreted as advice. The article is based on the observed metrics at the time of writing, but you should always make your own analysis and trade or invest at your own responsibility.