
Unlocking the Growth Potential of NYSE:BMA.
By Mill Chart
Last update: Sep 27, 2024
In this article we will dive into BANCO MACRO SA-ADR (NYSE:BMA) as a possible candidate for growth investing. Investors should always do their own research, but we noticed BANCO MACRO SA-ADR showing up in our CANSLIM growth screen, which makes it worth to investigate a bit more.
Why NYSE:BMA may be interesting for canslim investors.
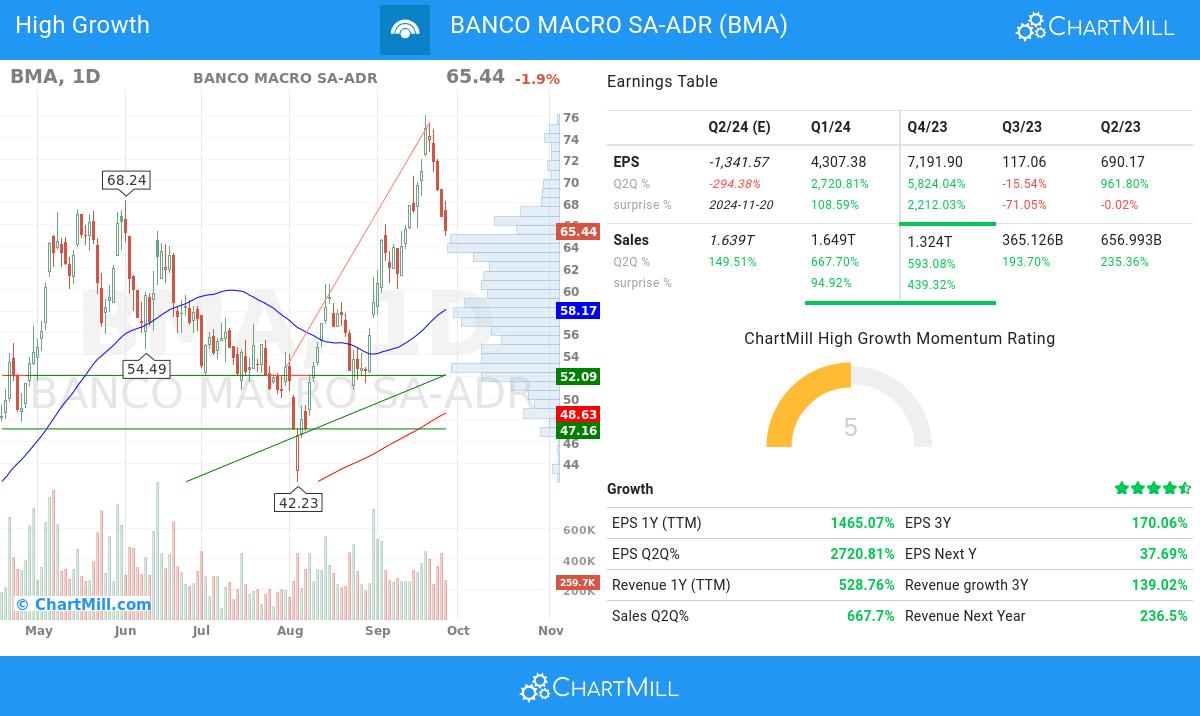
- With a favorable trend in its quarter-to-quarter (Q2Q) earnings per share (EPS), BANCO MACRO SA-ADR highlights its ability to generate increasing profitability, showcasing a 3.0K% growth.
- BANCO MACRO SA-ADR has achieved significant quarter-to-quarter (Q2Q) revenue growth of 668.0%, signaling its ability to capture market opportunities and drive top-line expansion. This growth underscores the company's effective execution and its potential for continued success.
- BANCO MACRO SA-ADR has experienced 170.0% growth in EPS over a 3-year period, demonstrating its ability to generate sustained and positive earnings momentum.
- With a solid Return on Equity (ROE) of 25.68%, BANCO MACRO SA-ADR exemplifies its ability to generate favorable returns on shareholder investments. This metric demonstrates the company's commitment to maximizing shareholder value.
- BANCO MACRO SA-ADR has maintained a healthy Relative Strength (RS) over the analyzed period, with a current 98.65 rating. This demonstrates the stock's ability to outperform its peers and indicates its competitive positioning. BANCO MACRO SA-ADR is well-positioned for potential price growth opportunities.
- With a current Debt-to-Equity ratio at 0.14, BANCO MACRO SA-ADR showcases its disciplined capital structure. The company's prudent management of debt obligations contributes to its financial stability and long-term sustainability.
- With institutional shareholders at 8.37%, BANCO MACRO SA-ADR demonstrates a healthy ownership distribution. This reflects a mix of institutional and individual investors, creating a market environment that may foster increased trading activity and price discovery.
Technical analysis of NYSE:BMA
Every day, ChartMill assigns a Technical Rating to each stock, providing a score ranging from 0 to 10. This rating is determined by evaluating various technical indicators and properties.
We assign a technical rating of 10 out of 10 to BMA. Both in the recent history as in the last year, BMA has proven to be a steady performer, scoring decent points in every aspect analyzed.
- The long and short term trends are both positive. This is looking good!
- Looking at the yearly performance, BMA did better than 98% of all other stocks. We also observe that the gains produced by BMA over the past year are nicely spread over this period.
- BMA is part of the Banks industry. There are 403 other stocks in this industry. BMA outperforms 99% of them.
- BMA is currently trading in the upper part of its 52 week range. The S&P500 Index however is currently trading near a new high, so BMA is lagging the market slightly.
- In the last month BMA has a been trading in the 52.33 - 76.08 range, which is quite wide. It is currently trading in the middle of this range, so some resistance may be found above.
Our latest full technical report of BMA contains the most current technical analsysis.
What else is there to say on the fundamentals of NYSE:BMA?
ChartMill utilizes a proprietary algorithm to assign a Fundamental Rating to every stock. This rating, ranging from 0 to 10, is computed daily by analyzing a variety of fundamental indicators and properties.
Overall BMA gets a fundamental rating of 4 out of 10. We evaluated BMA against 403 industry peers in the Banks industry. Both the profitability and financial health of BMA have multiple concerns. BMA is valued quite expensively, but it does show have an excellent growth rating.
Our latest full fundamental report of BMA contains the most current fundamental analsysis.
More ideas for growth investing can be found on ChartMill in our CANSLIM screen.
Disclaimer
This article should in no way be interpreted as advice. The article is based on the observed metrics at the time of writing, but you should always make your own analysis and trade or invest at your own responsibility.