
Is BEST BUY CO INC (NYSE:BBY) suited for dividend investing?
By Mill Chart
Last update: Mar 5, 2025
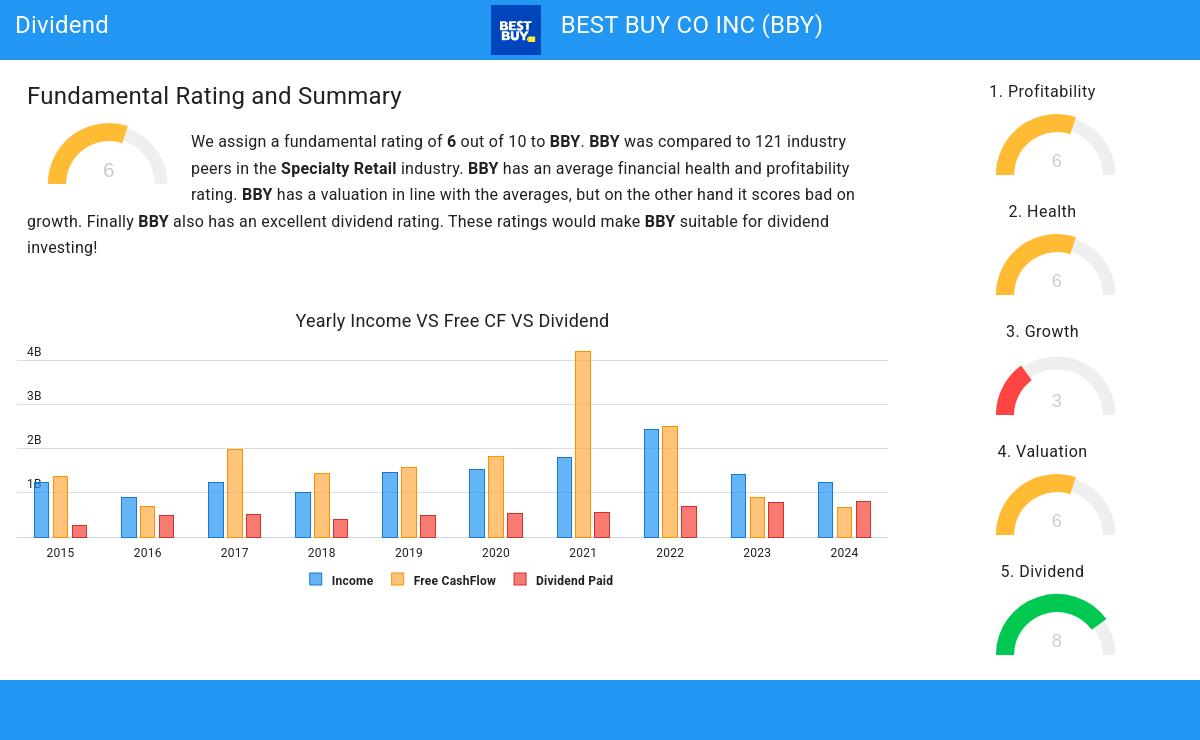
Consider BEST BUY CO INC (NYSE:BBY) as a top pick for dividend investors, identified by our stock screening tool. NYSE:BBY shines in terms of profitability, solvency, and liquidity, all while paying a decent dividend. Let's dive deeper into the analysis.
Evaluating Dividend: NYSE:BBY
ChartMill assigns a proprietary Dividend Rating to each stock. The score is computed by evaluating various valuation aspects, like the yield, the history, the dividend growth and sustainability. NYSE:BBY was assigned a score of 8 for dividend:
- BBY has a Yearly Dividend Yield of 5.05%, which is a nice return.
- BBY's Dividend Yield is rather good when compared to the industry average which is at 4.80. BBY pays more dividend than 90.68% of the companies in the same industry.
- Compared to an average S&P500 Dividend Yield of 2.30, BBY pays a better dividend.
- On average, the dividend of BBY grows each year by 15.34%, which is quite nice.
- BBY has been paying a dividend for at least 10 years, so it has a reliable track record.
- BBY has not decreased its dividend for at least 10 years, so it has a reliable track record of non decreasing dividend.
- BBY's earnings are growing more than its dividend. This makes the dividend growth sustainable.
How We Gauge Health for NYSE:BBY
ChartMill utilizes a Health Rating to assess stocks, scoring them on a scale of 0 to 10. This rating takes into account a variety of liquidity and solvency ratios, both in absolute terms and in comparison to industry peers. NYSE:BBY has earned a 6 out of 10:
- BBY has an Altman-Z score of 3.75. This indicates that BBY is financially healthy and has little risk of bankruptcy at the moment.
- BBY has a Altman-Z score of 3.75. This is amongst the best in the industry. BBY outperforms 81.36% of its industry peers.
- BBY has a debt to FCF ratio of 1.12. This is a very positive value and a sign of high solvency as it would only need 1.12 years to pay back of all of its debts.
- BBY has a better Debt to FCF ratio (1.12) than 80.51% of its industry peers.
- BBY has a Debt/Equity ratio of 0.37. This is a healthy value indicating a solid balance between debt and equity.
Analyzing Profitability Metrics
ChartMill employs its own Profitability Rating system for stock evaluation. This score, ranging from 0 to 10, is derived from an analysis of diverse profitability metrics and margins. In the case of NYSE:BBY, the assigned 6 is noteworthy for profitability:
- The Return On Assets of BBY (7.46%) is better than 77.97% of its industry peers.
- With an excellent Return On Equity value of 41.21%, BBY belongs to the best of the industry, outperforming 91.53% of the companies in the same industry.
- With an excellent Return On Invested Capital value of 19.60%, BBY belongs to the best of the industry, outperforming 87.29% of the companies in the same industry.
- BBY had an Average Return On Invested Capital over the past 3 years of 25.19%. This is significantly above the industry average of 14.02%.
- The last Return On Invested Capital (19.60%) for BBY is well below the 3 year average (25.19%), which needs to be investigated, but indicates that BBY had better years and this may not be a problem.
- The Profit Margin of BBY (3.01%) is better than 66.95% of its industry peers.
More Best Dividend stocks can be found in our Best Dividend screener.
For an up to date full fundamental analysis you can check the fundamental report of BBY
Keep in mind
This is not investing advice! The article highlights some of the observations at the time of writing, but you should always make your own analysis and invest based on your own insights.
66
+2.53 (+3.99%)
Find more stocks in the Stock Screener
BBY Latest News and Analysis
 11 days ago - ChartmillGapping S&P500 stocks in Monday's session
Looking for opportunities in today's market? Check out the S&P500 gap up and gap down stocks on Monday and stay ahead of the market trends.
 11 days ago - ChartmillGet insights into the top movers in the S&P500 index of Monday's pre-market session.
Let's have a look at what is happening on the US markets before the opening bell on Monday. Below you can find the top S&P500 gainers and losers in today's pre-market session.
 17 days ago - ChartmillTuesday's session: top gainers and losers in the S&P500 index
Curious about the top performers within the S&P500 index one hour before the close of the markets on Tuesday? Dive into the list of today's session's top gainers and losers for a comprehensive overview.
