
Is NYSE:BBY a Good Fit for Dividend Investing?
By Mill Chart
Last update: Feb 12, 2025
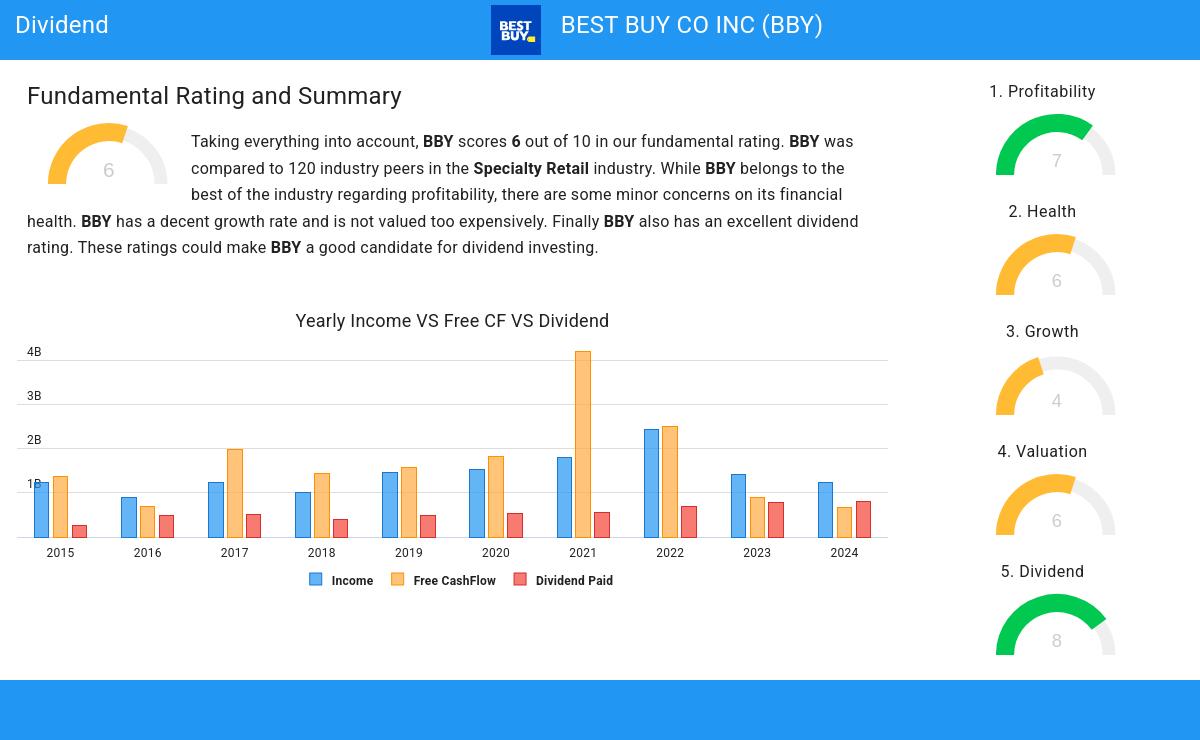
BEST BUY CO INC (NYSE:BBY) is a hidden gem unveiled by our stock screening tool, featuring a promising dividend outlook alongside solid fundamentals. NYSE:BBY demonstrates decent financial health and profitability while ensuring a sustainable dividend. Let's break it down further.
Exploring NYSE:BBY's Dividend
To gauge a stock's dividend quality, ChartMill utilizes a Dividend Rating ranging from 0 to 10. This comprehensive assessment considers various dividend aspects, including yield, history, growth, and sustainability. NYSE:BBY has achieved a 8 out of 10:
- BBY has a Yearly Dividend Yield of 4.38%, which is a nice return.
- Compared to an average industry Dividend Yield of 4.06, BBY pays a better dividend. On top of this BBY pays more dividend than 91.45% of the companies listed in the same industry.
- Compared to an average S&P500 Dividend Yield of 2.30, BBY pays a better dividend.
- The dividend of BBY is nicely growing with an annual growth rate of 15.34%!
- BBY has paid a dividend for at least 10 years, which is a reliable track record.
- BBY has not decreased their dividend for at least 10 years, which is a reliable track record.
What does the Health looks like for NYSE:BBY
ChartMill assigns a Health Rating to every stock. This score ranges from 0 to 10 and evaluates the different health aspects like liquidity and solvency, both absolutely, but also relative to the industry peers. NYSE:BBY scores a 6 out of 10:
- An Altman-Z score of 3.86 indicates that BBY is not in any danger for bankruptcy at the moment.
- With an excellent Altman-Z score value of 3.86, BBY belongs to the best of the industry, outperforming 81.20% of the companies in the same industry.
- BBY has a debt to FCF ratio of 1.12. This is a very positive value and a sign of high solvency as it would only need 1.12 years to pay back of all of its debts.
- BBY has a Debt to FCF ratio of 1.12. This is amongst the best in the industry. BBY outperforms 81.20% of its industry peers.
- A Debt/Equity ratio of 0.37 indicates that BBY is not too dependend on debt financing.
Understanding NYSE:BBY's Profitability
ChartMill assigns a proprietary Profitability Rating to each stock. The score is computed by evaluating various profitability ratios and margins and ranges from 0 to 10. NYSE:BBY was assigned a score of 7 for profitability:
- BBY's Return On Assets of 7.46% is fine compared to the rest of the industry. BBY outperforms 78.63% of its industry peers.
- BBY has a better Return On Equity (41.21%) than 91.45% of its industry peers.
- Looking at the Return On Invested Capital, with a value of 19.60%, BBY belongs to the top of the industry, outperforming 87.18% of the companies in the same industry.
- BBY had an Average Return On Invested Capital over the past 3 years of 25.19%. This is significantly above the industry average of 12.41%.
- The last Return On Invested Capital (19.60%) for BBY is well below the 3 year average (25.19%), which needs to be investigated, but indicates that BBY had better years and this may not be a problem.
- Looking at the Profit Margin, with a value of 3.01%, BBY is in the better half of the industry, outperforming 67.52% of the companies in the same industry.
More Best Dividend stocks can be found in our Best Dividend screener.
Our latest full fundamental report of BBY contains the most current fundamental analsysis.
Keep in mind
This article should in no way be interpreted as advice. The article is based on the observed metrics at the time of writing, but you should always make your own analysis and trade or invest at your own responsibility.
66
+2.53 (+3.99%)
Find more stocks in the Stock Screener
BBY Latest News and Analysis
 10 days ago - ChartmillGapping S&P500 stocks in Monday's session
Looking for opportunities in today's market? Check out the S&P500 gap up and gap down stocks on Monday and stay ahead of the market trends.
 10 days ago - ChartmillGet insights into the top movers in the S&P500 index of Monday's pre-market session.
Let's have a look at what is happening on the US markets before the opening bell on Monday. Below you can find the top S&P500 gainers and losers in today's pre-market session.
 16 days ago - ChartmillTuesday's session: top gainers and losers in the S&P500 index
Curious about the top performers within the S&P500 index one hour before the close of the markets on Tuesday? Dive into the list of today's session's top gainers and losers for a comprehensive overview.
