
Why NYSE:BBY provides a good dividend, while having solid fundamentals.
By Mill Chart
Last update: Oct 28, 2024
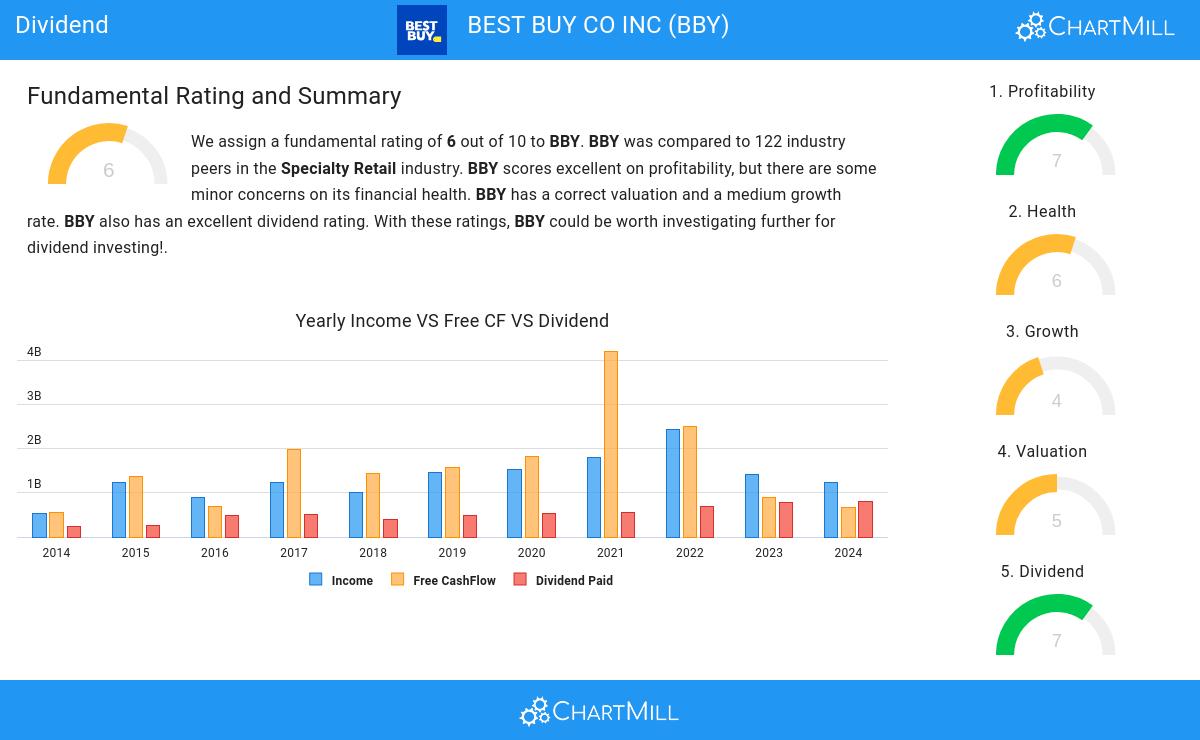
BEST BUY CO INC (NYSE:BBY) was identified as a stock worth exploring by dividend investors by our stock screener. NYSE:BBY scores well on profitability, solvency and liquidity. At the same time it seems to pay a decent dividend. We'll explore this a bit deeper below.
Dividend Assessment of NYSE:BBY
To gauge a stock's dividend quality, ChartMill utilizes a Dividend Rating ranging from 0 to 10. This comprehensive assessment considers various dividend aspects, including yield, history, growth, and sustainability. NYSE:BBY has achieved a 7 out of 10:
- Compared to an average industry Dividend Yield of 3.02, BBY pays a better dividend. On top of this BBY pays more dividend than 93.33% of the companies listed in the same industry.
- BBY's Dividend Yield is rather good when compared to the S&P500 average which is at 2.21.
- On average, the dividend of BBY grows each year by 15.34%, which is quite nice.
- BBY has paid a dividend for at least 10 years, which is a reliable track record.
- BBY has not decreased its dividend for at least 10 years, so it has a reliable track record of non decreasing dividend.
Health Analysis for NYSE:BBY
Every stock is evaluated by ChartMill, receiving a Health Rating on a scale of 0 to 10. This assessment considers different health aspects, including liquidity and solvency, both in absolute terms and relative to industry peers. NYSE:BBY has achieved a 6 out of 10:
- BBY has an Altman-Z score of 4.31. This indicates that BBY is financially healthy and has little risk of bankruptcy at the moment.
- With an excellent Altman-Z score value of 4.31, BBY belongs to the best of the industry, outperforming 83.33% of the companies in the same industry.
- BBY has a debt to FCF ratio of 0.85. This is a very positive value and a sign of high solvency as it would only need 0.85 years to pay back of all of its debts.
- Looking at the Debt to FCF ratio, with a value of 0.85, BBY belongs to the top of the industry, outperforming 80.83% of the companies in the same industry.
- BBY has a Debt/Equity ratio of 0.37. This is a healthy value indicating a solid balance between debt and equity.
Profitability Analysis for NYSE:BBY
ChartMill's Profitability Rating offers a unique perspective on stock analysis, providing scores from 0 to 10. These ratings consider a wide range of profitability metrics and margins, both in comparison to industry peers and on their own merits. For NYSE:BBY, the assigned 7 is a significant indicator of profitability:
- BBY's Return On Assets of 8.06% is fine compared to the rest of the industry. BBY outperforms 80.00% of its industry peers.
- BBY has a better Return On Equity (40.55%) than 89.17% of its industry peers.
- BBY's Return On Invested Capital of 19.41% is amongst the best of the industry. BBY outperforms 87.50% of its industry peers.
- The Average Return On Invested Capital over the past 3 years for BBY is significantly above the industry average of 12.36%.
- The 3 year average ROIC (25.19%) for BBY is well above the current ROIC(19.41%). The reason for the recent decline needs to be investigated.
- BBY's Profit Margin of 2.96% is fine compared to the rest of the industry. BBY outperforms 64.17% of its industry peers.
Every day, new Best Dividend stocks can be found on ChartMill in our Best Dividend screener.
Our latest full fundamental report of BBY contains the most current fundamental analsysis.
Disclaimer
Important Note: The content of this article is not intended as trading advice. It is essential to perform your own analysis and exercise caution when making trading decisions. The article presents observations created by automated analysis but does not guarantee any trading or investment outcomes. Always trade responsibly and make independent judgments.
66
+2.53 (+3.99%)
Find more stocks in the Stock Screener
BBY Latest News and Analysis
 11 days ago - ChartmillGapping S&P500 stocks in Monday's session
Looking for opportunities in today's market? Check out the S&P500 gap up and gap down stocks on Monday and stay ahead of the market trends.
 11 days ago - ChartmillGet insights into the top movers in the S&P500 index of Monday's pre-market session.
Let's have a look at what is happening on the US markets before the opening bell on Monday. Below you can find the top S&P500 gainers and losers in today's pre-market session.
 16 days ago - ChartmillTuesday's session: top gainers and losers in the S&P500 index
Curious about the top performers within the S&P500 index one hour before the close of the markets on Tuesday? Dive into the list of today's session's top gainers and losers for a comprehensive overview.
