
Why NYSE:BBY provides a good dividend, while having solid fundamentals.
By Mill Chart
Last update: Oct 4, 2024
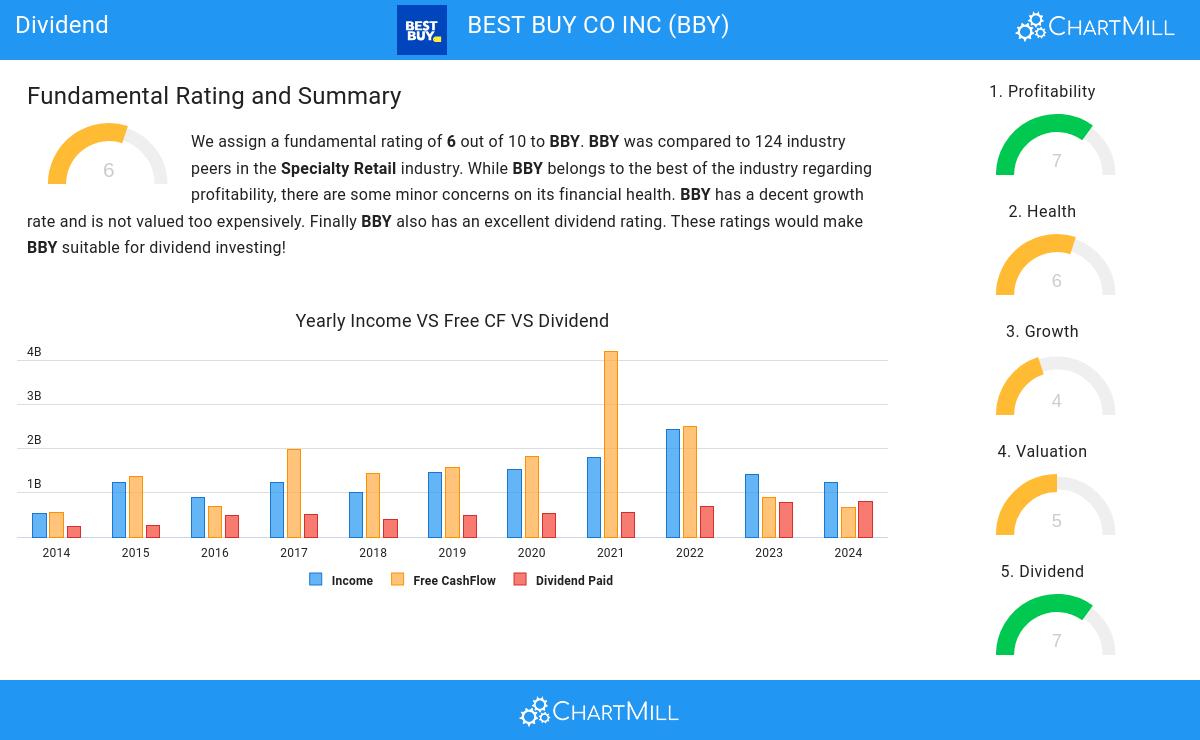
Discover BEST BUY CO INC (NYSE:BBY)—a stock that our stock screener has recognized as a solid dividend pick with strong fundamentals. NYSE:BBY showcases decent financial health and profitability while providing a sustainable dividend. We'll explore the specifics further.
Unpacking NYSE:BBY's Dividend Rating
To gauge a stock's dividend quality, ChartMill utilizes a Dividend Rating ranging from 0 to 10. This comprehensive assessment considers various dividend aspects, including yield, history, growth, and sustainability. NYSE:BBY has achieved a 7 out of 10:
- Compared to an average industry Dividend Yield of 3.64, BBY pays a better dividend. On top of this BBY pays more dividend than 90.98% of the companies listed in the same industry.
- Compared to an average S&P500 Dividend Yield of 2.20, BBY pays a better dividend.
- The dividend of BBY is nicely growing with an annual growth rate of 15.34%!
- BBY has paid a dividend for at least 10 years, which is a reliable track record.
- BBY has not decreased its dividend for at least 10 years, so it has a reliable track record of non decreasing dividend.
Assessing Health Metrics for NYSE:BBY
A critical element of ChartMill's stock evaluation is the Health Rating, which spans from 0 to 10. This rating considers multiple health factors, including liquidity and solvency, both in absolute terms and relative to industry peers. NYSE:BBY has received a 6 out of 10:
- An Altman-Z score of 4.37 indicates that BBY is not in any danger for bankruptcy at the moment.
- BBY's Altman-Z score of 4.37 is amongst the best of the industry. BBY outperforms 83.61% of its industry peers.
- The Debt to FCF ratio of BBY is 0.85, which is an excellent value as it means it would take BBY, only 0.85 years of fcf income to pay off all of its debts.
- BBY has a Debt to FCF ratio of 0.85. This is amongst the best in the industry. BBY outperforms 80.33% of its industry peers.
- A Debt/Equity ratio of 0.37 indicates that BBY is not too dependend on debt financing.
Profitability Analysis for NYSE:BBY
ChartMill's Profitability Rating offers a unique perspective on stock analysis, providing scores from 0 to 10. These ratings consider a wide range of profitability metrics and margins, both in comparison to industry peers and on their own merits. For NYSE:BBY, the assigned 7 is a significant indicator of profitability:
- BBY's Return On Assets of 8.06% is amongst the best of the industry. BBY outperforms 80.33% of its industry peers.
- Looking at the Return On Equity, with a value of 40.55%, BBY belongs to the top of the industry, outperforming 89.34% of the companies in the same industry.
- BBY has a Return On Invested Capital of 19.41%. This is amongst the best in the industry. BBY outperforms 87.70% of its industry peers.
- BBY had an Average Return On Invested Capital over the past 3 years of 25.19%. This is significantly above the industry average of 12.30%.
- The 3 year average ROIC (25.19%) for BBY is well above the current ROIC(19.41%). The reason for the recent decline needs to be investigated.
- With a decent Profit Margin value of 2.96%, BBY is doing good in the industry, outperforming 63.93% of the companies in the same industry.
More Best Dividend stocks can be found in our Best Dividend screener.
Our latest full fundamental report of BBY contains the most current fundamental analsysis.
Keep in mind
Important Note: The content of this article is not intended as trading advice. It is essential to perform your own analysis and exercise caution when making trading decisions. The article presents observations created by automated analysis but does not guarantee any trading or investment outcomes. Always trade responsibly and make independent judgments.
66
+2.53 (+3.99%)
Find more stocks in the Stock Screener
BBY Latest News and Analysis
 10 days ago - ChartmillGapping S&P500 stocks in Monday's session
Looking for opportunities in today's market? Check out the S&P500 gap up and gap down stocks on Monday and stay ahead of the market trends.
 10 days ago - ChartmillGet insights into the top movers in the S&P500 index of Monday's pre-market session.
Let's have a look at what is happening on the US markets before the opening bell on Monday. Below you can find the top S&P500 gainers and losers in today's pre-market session.
 16 days ago - ChartmillTuesday's session: top gainers and losers in the S&P500 index
Curious about the top performers within the S&P500 index one hour before the close of the markets on Tuesday? Dive into the list of today's session's top gainers and losers for a comprehensive overview.
