
Is NYSE:BBY a Good Fit for Dividend Investing?
By Mill Chart
Last update: Sep 12, 2024
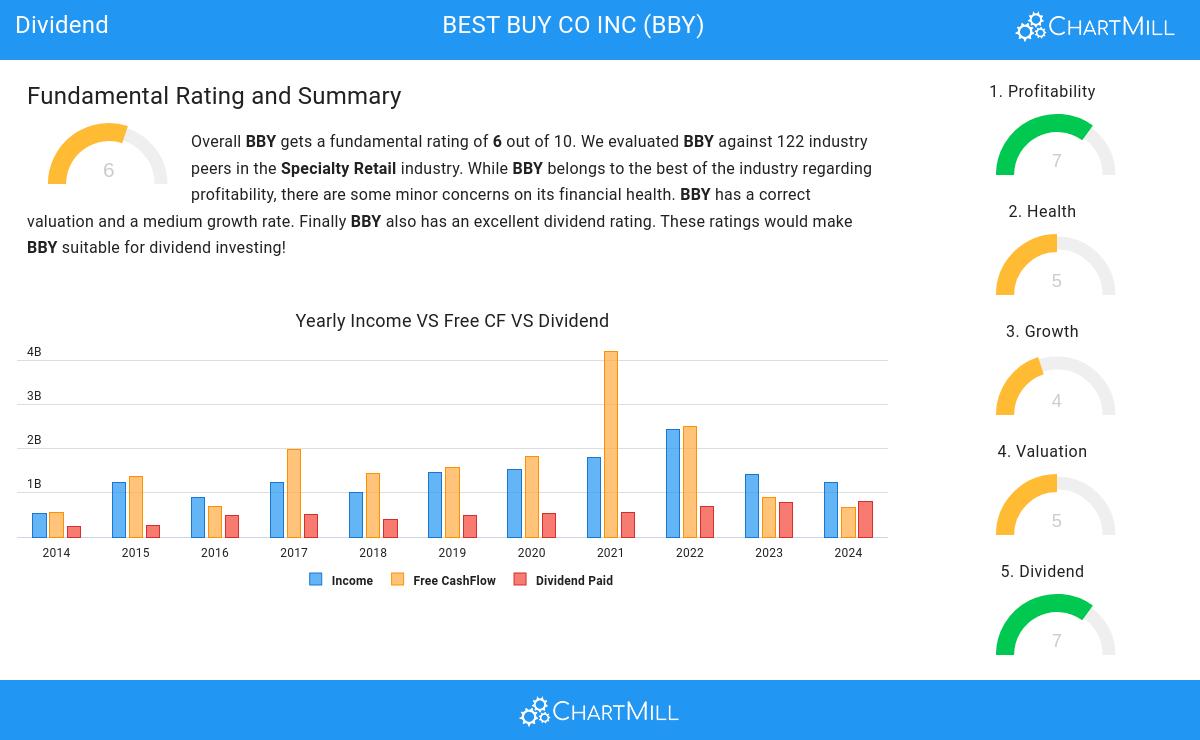
Consider BEST BUY CO INC (NYSE:BBY) as a top pick for dividend investors, identified by our stock screening tool. NYSE:BBY shines in terms of profitability, solvency, and liquidity, all while paying a decent dividend. Let's dive deeper into the analysis.
How do we evaluate the Dividend for NYSE:BBY?
To gauge a stock's dividend quality, ChartMill utilizes a Dividend Rating ranging from 0 to 10. This comprehensive assessment considers various dividend aspects, including yield, history, growth, and sustainability. NYSE:BBY has achieved a 7 out of 10:
- BBY's Dividend Yield is rather good when compared to the industry average which is at 3.79. BBY pays more dividend than 91.74% of the companies in the same industry.
- Compared to an average S&P500 Dividend Yield of 2.26, BBY pays a better dividend.
- The dividend of BBY is nicely growing with an annual growth rate of 15.34%!
- BBY has paid a dividend for at least 10 years, which is a reliable track record.
- BBY has not decreased their dividend for at least 10 years, which is a reliable track record.
What does the Health looks like for NYSE:BBY
A critical element of ChartMill's stock evaluation is the Health Rating, which spans from 0 to 10. This rating considers multiple health factors, including liquidity and solvency, both in absolute terms and relative to industry peers. NYSE:BBY has received a 5 out of 10:
- BBY has a debt to FCF ratio of 0.85. This is a very positive value and a sign of high solvency as it would only need 0.85 years to pay back of all of its debts.
- BBY's Debt to FCF ratio of 0.85 is amongst the best of the industry. BBY outperforms 80.99% of its industry peers.
- A Debt/Equity ratio of 0.37 indicates that BBY is not too dependend on debt financing.
Analyzing Profitability Metrics
ChartMill's Profitability Rating offers a unique perspective on stock analysis, providing scores from 0 to 10. These ratings consider a wide range of profitability metrics and margins, both in comparison to industry peers and on their own merits. For NYSE:BBY, the assigned 7 is a significant indicator of profitability:
- BBY has a Return On Assets of 8.06%. This is in the better half of the industry: BBY outperforms 79.34% of its industry peers.
- BBY has a Return On Equity of 40.55%. This is amongst the best in the industry. BBY outperforms 90.08% of its industry peers.
- BBY's Return On Invested Capital of 19.41% is amongst the best of the industry. BBY outperforms 87.60% of its industry peers.
- The Average Return On Invested Capital over the past 3 years for BBY is significantly above the industry average of 12.50%.
- The 3 year average ROIC (25.19%) for BBY is well above the current ROIC(19.41%). The reason for the recent decline needs to be investigated.
- BBY has a Profit Margin of 2.96%. This is in the better half of the industry: BBY outperforms 65.29% of its industry peers.
Every day, new Best Dividend stocks can be found on ChartMill in our Best Dividend screener.
For an up to date full fundamental analysis you can check the fundamental report of BBY
Disclaimer
This is not investing advice! The article highlights some of the observations at the time of writing, but you should always make your own analysis and invest based on your own insights.
66
+2.53 (+3.99%)
Find more stocks in the Stock Screener
BBY Latest News and Analysis
 10 days ago - ChartmillGapping S&P500 stocks in Monday's session
Looking for opportunities in today's market? Check out the S&P500 gap up and gap down stocks on Monday and stay ahead of the market trends.
 10 days ago - ChartmillGet insights into the top movers in the S&P500 index of Monday's pre-market session.
Let's have a look at what is happening on the US markets before the opening bell on Monday. Below you can find the top S&P500 gainers and losers in today's pre-market session.
 16 days ago - ChartmillTuesday's session: top gainers and losers in the S&P500 index
Curious about the top performers within the S&P500 index one hour before the close of the markets on Tuesday? Dive into the list of today's session's top gainers and losers for a comprehensive overview.
