NYSE:BAH is not too expensive for the growth it is showing.
By Mill Chart
Last update: Feb 25, 2025
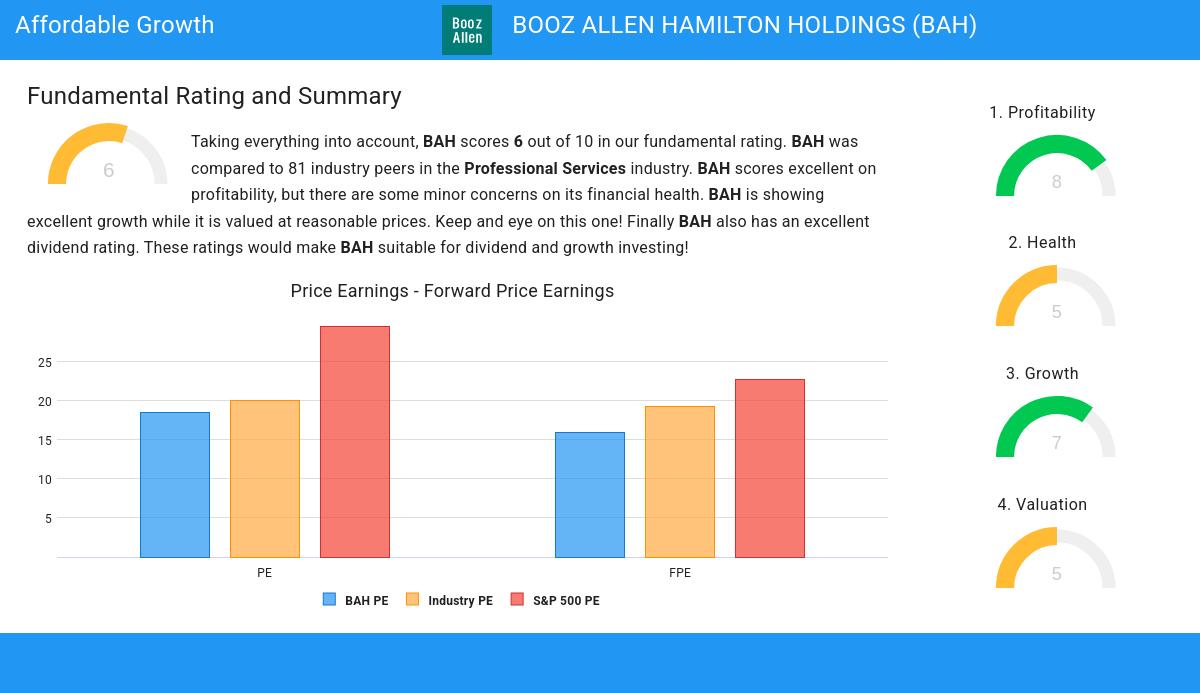
Our stock screening tool has pinpointed BOOZ ALLEN HAMILTON HOLDINGS (NYSE:BAH) as a growth stock that isn't overvalued. NYSE:BAH is excelling in various growth indicators while maintaining a solid financial footing. Furthermore, it remains attractively priced. Let's delve into the specifics below.
Growth Examination for NYSE:BAH
Every stock receives a Growth Rating from ChartMill, ranging from 0 to 10. This rating assesses various growth aspects, including historical and projected EPS and revenue growth. NYSE:BAH boasts a 7 out of 10:
- The Earnings Per Share has grown by an nice 17.18% over the past year.
- The Earnings Per Share has been growing by 14.79% on average over the past years. This is quite good.
- Looking at the last year, BAH shows a very strong growth in Revenue. The Revenue has grown by 42.57%.
- The Revenue has been growing by 9.72% on average over the past years. This is quite good.
- BAH is expected to show quite a strong growth in Earnings Per Share. In the coming years, the EPS will grow by 13.07% yearly.
- Based on estimates for the next years, BAH will show a quite strong growth in Revenue. The Revenue will grow by 9.18% on average per year.
How do we evaluate the Valuation for NYSE:BAH?
ChartMill assigns a proprietary Valuation Rating to each stock. The score is computed by evaluating various valuation aspects, like price to earnings and free cash flow, both absolutely as relative to the market and industry. NYSE:BAH was assigned a score of 5 for valuation:
- Compared to an average S&P500 Price/Earnings ratio of 29.53, BAH is valued a bit cheaper.
- BAH's Price/Forward Earnings ratio is a bit cheaper when compared to the industry. BAH is cheaper than 64.10% of the companies in the same industry.
- The average S&P500 Price/Forward Earnings ratio is at 22.65. BAH is valued slightly cheaper when compared to this.
- Based on the Enterprise Value to EBITDA ratio, BAH is valued a bit cheaper than the industry average as 75.64% of the companies are valued more expensively.
- Based on the Price/Free Cash Flow ratio, BAH is valued a bit cheaper than the industry average as 74.36% of the companies are valued more expensively.
- BAH has an outstanding profitability rating, which may justify a higher PE ratio.
- A more expensive valuation may be justified as BAH's earnings are expected to grow with 13.07% in the coming years.
Health Assessment of NYSE:BAH
A critical element of ChartMill's stock evaluation is the Health Rating, which spans from 0 to 10. This rating considers multiple health factors, including liquidity and solvency, both in absolute terms and relative to industry peers. NYSE:BAH has received a 5 out of 10:
- BAH has an Altman-Z score of 5.26. This indicates that BAH is financially healthy and has little risk of bankruptcy at the moment.
- BAH's Altman-Z score of 5.26 is amongst the best of the industry. BAH outperforms 85.90% of its industry peers.
- The Debt to FCF ratio of BAH is 4.00, which is a good value as it means it would take BAH, 4.00 years of fcf income to pay off all of its debts.
A Closer Look at Profitability for NYSE:BAH
ChartMill employs its own Profitability Rating system for stock evaluation. This score, ranging from 0 to 10, is derived from an analysis of diverse profitability metrics and margins. In the case of NYSE:BAH, the assigned 8 is noteworthy for profitability:
- BAH has a better Return On Assets (15.10%) than 91.03% of its industry peers.
- BAH's Return On Equity of 85.10% is amongst the best of the industry. BAH outperforms 94.87% of its industry peers.
- The Return On Invested Capital of BAH (23.56%) is better than 88.46% of its industry peers.
- The 3 year average ROIC (13.75%) for BAH is below the current ROIC(23.56%), indicating increased profibility in the last year.
- With a decent Profit Margin value of 7.00%, BAH is doing good in the industry, outperforming 74.36% of the companies in the same industry.
- The Operating Margin of BAH (11.08%) is better than 78.21% of its industry peers.
- In the last couple of years the Operating Margin of BAH has grown nicely.
- The Gross Margin of BAH (54.71%) is better than 62.82% of its industry peers.
More Affordable Growth stocks can be found in our Affordable Growth screener.
Check the latest full fundamental report of BAH for a complete fundamental analysis.
Disclaimer
This article should in no way be interpreted as advice. The article is based on the observed metrics at the time of writing, but you should always make your own analysis and trade or invest at your own responsibility.
113.68
+2.39 (+2.15%)
Find more stocks in the Stock Screener
BAH Latest News and Analysis
 3 days ago - ChartmillIn the world of growth stocks, BOOZ ALLEN HAMILTON HOLDINGS (NYSE:BAH) shines as a value proposition.
Based on Fundamental Analysis it can be said that NYSE:BAH is a growth stock which is not overvalued.
 10 days ago - ChartmillWhy the dividend investor may take a look at BOOZ ALLEN HAMILTON HOLDINGS (NYSE:BAH).
Is BOOZ ALLEN HAMILTON HOLDINGS (NYSE:BAH) a Good Fit for Dividend Investing?
