Exploring growth characteristics of AXON ENTERPRISE INC (NASDAQ:AXON).
By Mill Chart
Last update: Feb 25, 2025
In this article we will dive into AXON ENTERPRISE INC (NASDAQ:AXON) as a possible candidate for growth investing. Investors should always do their own research, but we noticed AXON ENTERPRISE INC showing up in our CANSLIM growth screen, which makes it worth to investigate a bit more.
Looking into the canslim metrics of AXON ENTERPRISE INC
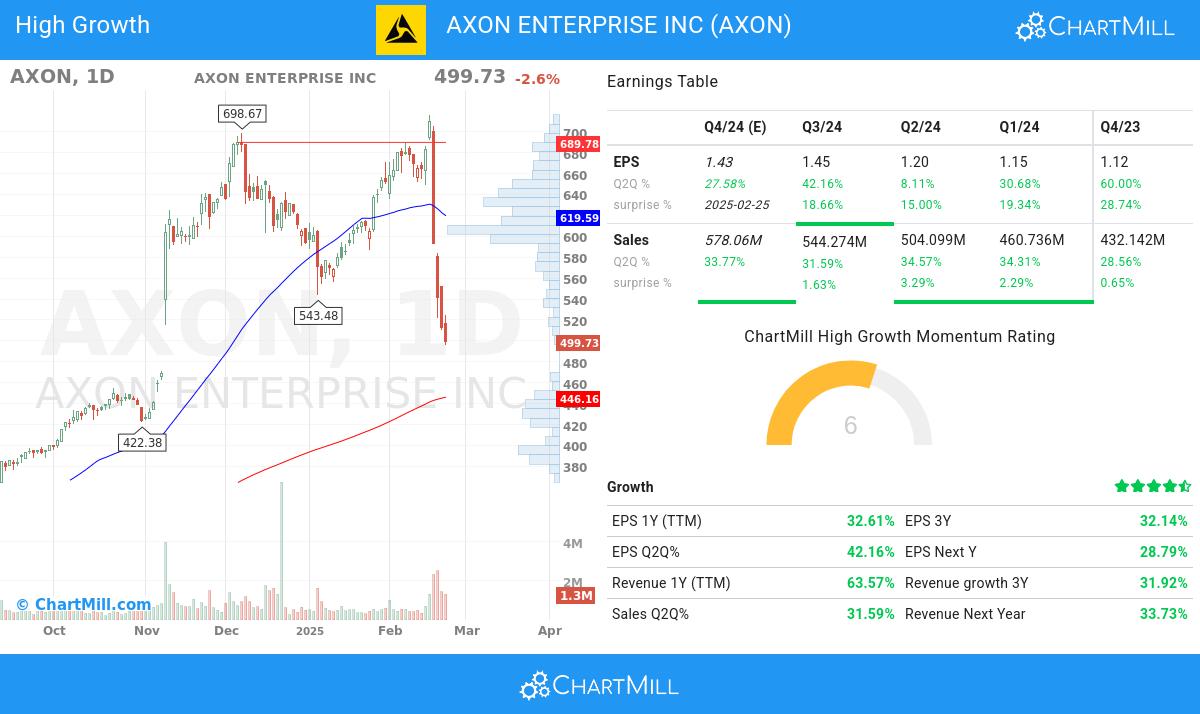
- The EPS of AXON ENTERPRISE INC has exhibited growth from one quarter to another (Q2Q), with a 42.16% increase. This underscores the company's ability to generate higher earnings and improve its financial standing.
- The q2q revenue growth of 31.59% of AXON ENTERPRISE INC highlights the company's ability to generate incremental revenue and suggests positive market demand for its products or services.
- AXON ENTERPRISE INC has experienced 32.14% growth in EPS over a 3-year period, demonstrating its ability to generate sustained and positive earnings momentum.
- The Return on Equity (ROE) of AXON ENTERPRISE INC stands at 20.59%, reflecting the company's strong profitability and effective utilization of shareholder equity. This metric signifies the company's ability to generate returns for its investors.
- The Relative Strength (RS) of AXON ENTERPRISE INC has been consistently solid, with a current 86.85 rating. This highlights the stock's ability to exhibit sustained price strength and signifies its competitive advantage. AXON ENTERPRISE INC exhibits strong prospects for further price appreciation.
- With a current Debt-to-Equity ratio at 0.32, AXON ENTERPRISE INC showcases its disciplined capital structure. The company's prudent management of debt obligations contributes to its financial stability and long-term sustainability.
- AXON ENTERPRISE INC exhibits a favorable ownership structure, with an institutional shareholder ownership of 82.93%. This signifies a diverse investor base, which can contribute to a more stable and efficient market for the stock.
Deciphering the Technical Picture of NASDAQ:AXON
ChartMill employs a sophisticated system to assign a Technical Rating to every stock in its analysis. This rating, which ranges from 0 to 10, is determined by carefully assessing multiple technical indicators and properties.
Taking everything into account, AXON scores 3 out of 10 in our technical rating. Although AXON is scoring some points because its good overall performance in the market in the past year, recent evolutions are not that positive. Both the medium and short term picture give negative signs.
- The long term trend is neutral, but the short term trend is negative. Better to stay away from this!
- Looking at the yearly performance, AXON did better than 86% of all other stocks. We also observe that the gains produced by AXON over the past year are nicely spread over this period. However, this overall performance is mostly based on the strong move around 4 months ago.
- AXON is an average performer in the Aerospace & Defense industry, it outperforms 67% of 65 stocks in the same industry.
- AXON is currently trading in the middle of its 52 week range. The S&P500 Index however is trading in the upper part of its 52 week range, so AXON is lagging the market slightly.
For an up to date full technical analysis you can check the technical report of AXON
A complete fundamental analysis of NASDAQ:AXON
At ChartMill, a crucial aspect of their analysis is the assignment of a Fundamental Rating to each stock. This rating, ranging from 0 to 10, is calculated daily by considering numerous fundamental indicators and properties.
AXON gets a fundamental rating of 6 out of 10. The analysis compared the fundamentals against 65 industry peers in the Aerospace & Defense industry. While AXON has a great health rating, its profitability is only average at the moment. AXON is valued quite expensively, but it does show have an excellent growth rating. This makes AXON very considerable for growth investing!
For an up to date full fundamental analysis you can check the fundamental report of AXON
More growth stocks can be found in our CANSLIM screen.
Disclaimer
Important Note: The content of this article is not intended as trading advice. It is essential to perform your own analysis and exercise caution when making trading decisions. The article presents observations created by automated analysis but does not guarantee any trading or investment outcomes. Always trade responsibly and make independent judgments.
590.67
+13.77 (+2.39%)
Find more stocks in the Stock Screener
AXON Latest News and Analysis
 4 days ago - ChartmillGet insights into the top movers in the S&P500 index of Monday's pre-market session.
Discover the top S&P500 movers in Monday's pre-market session and stay informed about market dynamics.
 15 days ago - ChartmillWhy the growth investor may take a look at AXON ENTERPRISE INC (NASDAQ:AXON).
A fundamental analysis of (NASDAQ:AXON): Is AXON ENTERPRISE INC (NASDAQ:AXON) suited for growth investing?
