
Exploring AVNET INC (NASDAQ:AVT)'s dividend characteristics.
By Mill Chart
Last update: Mar 26, 2025
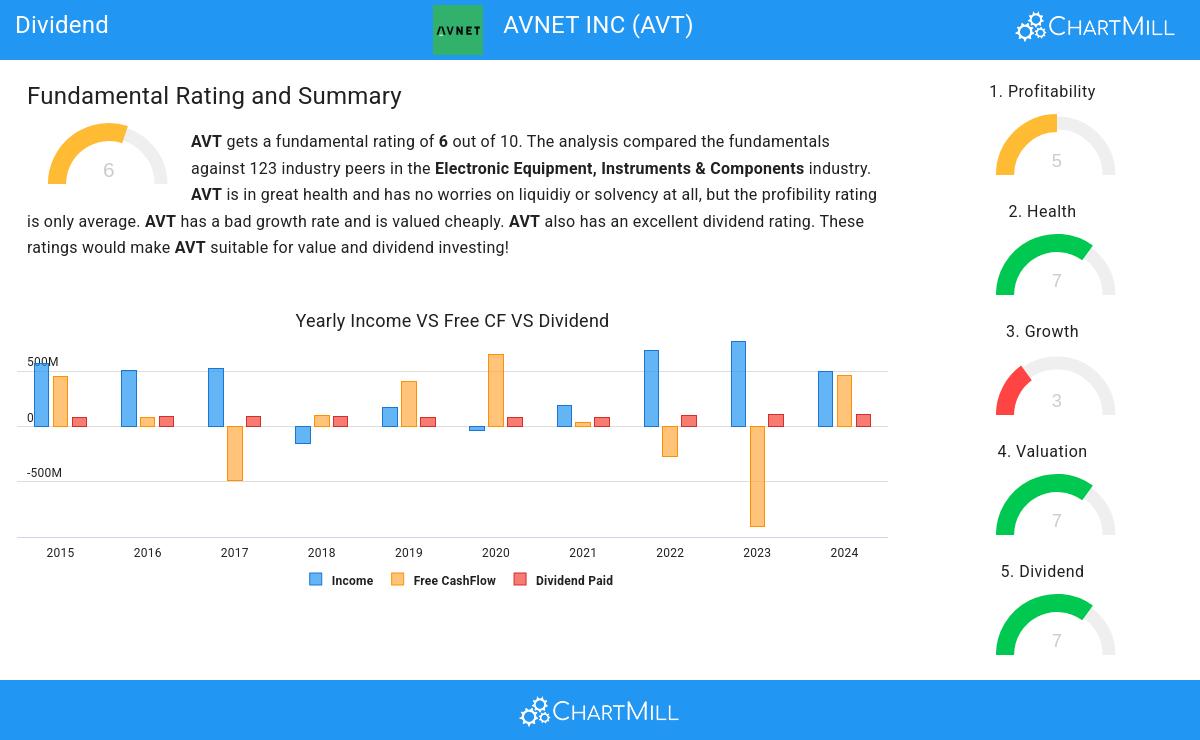
AVNET INC (NASDAQ:AVT) has caught the attention of dividend investors as a stock worth considering. AVT excels in profitability, solvency, and liquidity, all while providing a decent dividend. Let's delve into the details.
Dividend Assessment of AVT
ChartMill employs its own Dividend Rating system for all stocks. This score, on a scale of 0 to 10, is determined by evaluating different dividend factors, such as yield, historical performance, dividend growth, and sustainability. AVT has been assigned a 7 for dividend:
- Compared to an average industry Dividend Yield of 2.15, AVT pays a better dividend. On top of this AVT pays more dividend than 96.75% of the companies listed in the same industry.
- The dividend of AVT is nicely growing with an annual growth rate of 9.30%!
- AVT has been paying a dividend for at least 10 years, so it has a reliable track record.
- AVT has not decreased its dividend for at least 10 years, so it has a reliable track record of non decreasing dividend.
- 35.64% of the earnings are spent on dividend by AVT. This is a low number and sustainable payout ratio.
A Closer Look at Health for AVT
A critical element of ChartMill's stock evaluation is the Health Rating, which spans from 0 to 10. This rating considers multiple health factors, including liquidity and solvency, both in absolute terms and relative to industry peers. AVT has received a 7 out of 10:
- AVT has an Altman-Z score of 3.44. This indicates that AVT is financially healthy and has little risk of bankruptcy at the moment.
- AVT has a Altman-Z score of 3.44. This is in the better half of the industry: AVT outperforms 62.60% of its industry peers.
- AVT has a debt to FCF ratio of 2.36. This is a good value and a sign of high solvency as AVT would need 2.36 years to pay back of all of its debts.
- The Debt to FCF ratio of AVT (2.36) is better than 72.36% of its industry peers.
- Although AVT does not score too well on debt/equity it has very limited outstanding debt, which is well covered by the FCF. We will not put too much weight on the debt/equity number as it may be because of low equity, which could be a consequence of a share buyback program for instance. This needs to be investigated.
- AVT has a Current Ratio of 2.39. This indicates that AVT is financially healthy and has no problem in meeting its short term obligations.
Profitability Assessment of AVT
ChartMill assigns a proprietary Profitability Rating to each stock. The score is computed by evaluating various profitability ratios and margins and ranges from 0 to 10. AVT was assigned a score of 5 for profitability:
- AVT's Return On Assets of 2.66% is fine compared to the rest of the industry. AVT outperforms 60.98% of its industry peers.
- AVT has a better Return On Equity (6.56%) than 63.41% of its industry peers.
- With a decent Return On Invested Capital value of 7.34%, AVT is doing good in the industry, outperforming 73.98% of the companies in the same industry.
- The Average Return On Invested Capital over the past 3 years for AVT is above the industry average of 8.82%.
- AVT's Profit Margin has improved in the last couple of years.
- AVT's Operating Margin has improved in the last couple of years.
Our Best Dividend screener lists more Best Dividend stocks and is updated daily.
For an up to date full fundamental analysis you can check the fundamental report of AVT
Keep in mind
This is not investing advice! The article highlights some of the observations at the time of writing, but you should always make your own analysis and invest based on your own insights.
NASDAQ:AVT (4/16/2025, 12:25:49 PM)
46.53
+0.09 (+0.19%)
Find more stocks in the Stock Screener
