
Investors seeking growth at a reasonable cost should explore NASDAQ:ATAT.
By Mill Chart
Last update: Feb 12, 2025
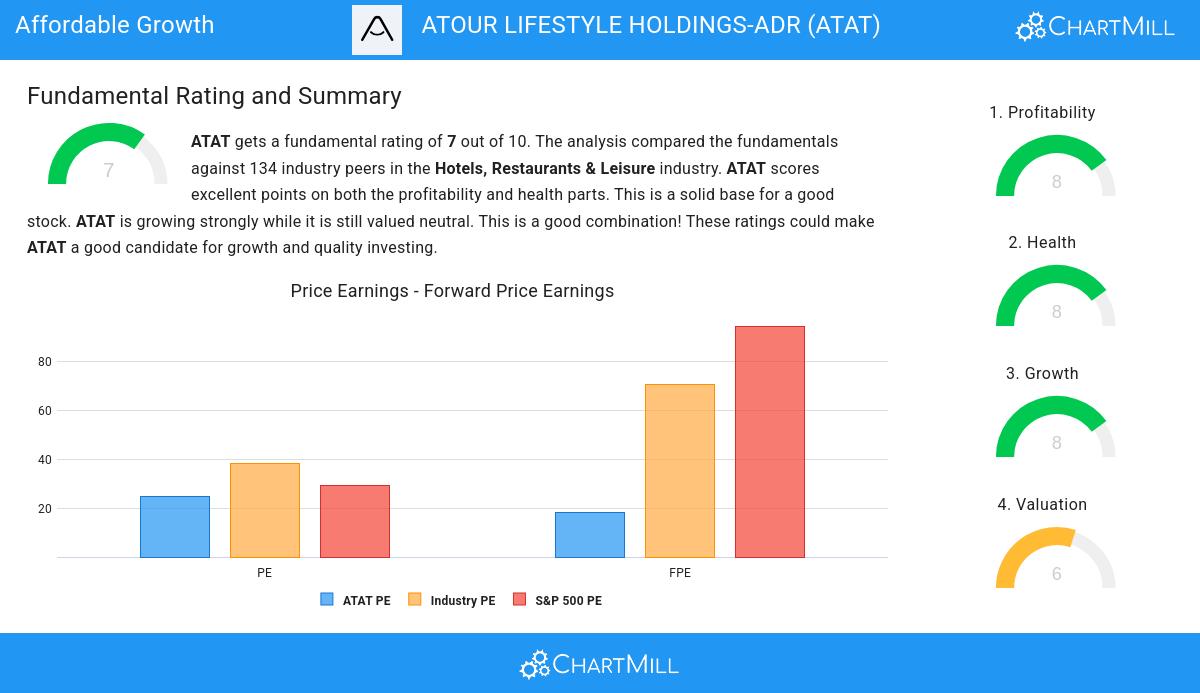
Uncover the potential of ATOUR LIFESTYLE HOLDINGS-ADR (NASDAQ:ATAT), a growth stock that our stock screener found to be reasonably priced. NASDAQ:ATAT is excelling in growth aspects, maintaining a healthy financial position, and still offers an attractive valuation. We'll examine each aspect in detail.
Exploring NASDAQ:ATAT's Growth
ChartMill assigns a Growth Rating to each stock, ranging from 0 to 10. This rating is determined by analyzing different growth elements, including EPS and revenue growth, spanning both historical and future figures. In the case of NASDAQ:ATAT, the assigned 8 reflects its growth potential:
- The Earnings Per Share has grown by an impressive 171.84% over the past year.
- The Revenue has grown by 76.11% in the past year. This is a very strong growth!
- Measured over the past years, ATAT shows a very strong growth in Revenue. The Revenue has been growing by 43.88% on average per year.
- ATAT is expected to show a strong growth in Earnings Per Share. In the coming years, the EPS will grow by 31.43% yearly.
- The Revenue is expected to grow by 35.12% on average over the next years. This is a very strong growth
Analyzing Valuation Metrics
ChartMill assigns a Valuation Rating to each stock, ranging from 0 to 10. This rating is calculated by analyzing different valuation elements, such as price to earnings and free cash flow, both in absolute terms and relative to the market and industry. In the case of NASDAQ:ATAT, the assigned 6 reflects its valuation:
- 63.36% of the companies in the same industry are more expensive than ATAT, based on the Price/Earnings ratio.
- Compared to the rest of the industry, the Price/Forward Earnings ratio of ATAT indicates a somewhat cheap valuation: ATAT is cheaper than 67.18% of the companies listed in the same industry.
- When comparing the Price/Forward Earnings ratio of ATAT to the average of the S&P500 Index (94.38), we can say ATAT is valued rather cheaply.
- Based on the Price/Free Cash Flow ratio, ATAT is valued a bit cheaper than the industry average as 78.63% of the companies are valued more expensively.
- The low PEG Ratio(NY), which compensates the Price/Earnings for growth, indicates a rather cheap valuation of the company.
- ATAT has an outstanding profitability rating, which may justify a higher PE ratio.
- A more expensive valuation may be justified as ATAT's earnings are expected to grow with 31.43% in the coming years.
Analyzing Health Metrics
ChartMill utilizes a Health Rating to assess stocks, scoring them on a scale of 0 to 10. This rating takes into account a variety of liquidity and solvency ratios, both in absolute terms and in comparison to industry peers. NASDAQ:ATAT has earned a 8 out of 10:
- ATAT has an Altman-Z score of 5.99. This indicates that ATAT is financially healthy and has little risk of bankruptcy at the moment.
- ATAT has a Altman-Z score of 5.99. This is amongst the best in the industry. ATAT outperforms 89.31% of its industry peers.
- The Debt to FCF ratio of ATAT is 0.06, which is an excellent value as it means it would take ATAT, only 0.06 years of fcf income to pay off all of its debts.
- ATAT has a better Debt to FCF ratio (0.06) than 95.42% of its industry peers.
- ATAT has a Debt/Equity ratio of 0.04. This is a healthy value indicating a solid balance between debt and equity.
- With an excellent Debt to Equity ratio value of 0.04, ATAT belongs to the best of the industry, outperforming 86.26% of the companies in the same industry.
- ATAT has a Current ratio of 1.97. This is amongst the best in the industry. ATAT outperforms 84.73% of its industry peers.
- The Quick ratio of ATAT (1.92) is better than 84.73% of its industry peers.
Profitability Assessment of NASDAQ:ATAT
ChartMill assigns a proprietary Profitability Rating to each stock. The score is computed by evaluating various profitability ratios and margins and ranges from 0 to 10. NASDAQ:ATAT was assigned a score of 8 for profitability:
- Looking at the Return On Assets, with a value of 16.16%, ATAT belongs to the top of the industry, outperforming 95.42% of the companies in the same industry.
- The Return On Equity of ATAT (44.79%) is better than 94.66% of its industry peers.
- ATAT's Return On Invested Capital of 19.32% is amongst the best of the industry. ATAT outperforms 92.37% of its industry peers.
- The last Return On Invested Capital (19.32%) for ATAT is above the 3 year average (9.25%), which is a sign of increasing profitability.
- Looking at the Profit Margin, with a value of 17.47%, ATAT belongs to the top of the industry, outperforming 92.37% of the companies in the same industry.
- The Operating Margin of ATAT (21.33%) is better than 80.92% of its industry peers.
- ATAT's Operating Margin has improved in the last couple of years.
- The Gross Margin of ATAT (81.83%) is better than 96.18% of its industry peers.
Our Affordable Growth screener lists more Affordable Growth stocks and is updated daily.
Our latest full fundamental report of ATAT contains the most current fundamental analsysis.
Disclaimer
This is not investing advice! The article highlights some of the observations at the time of writing, but you should always make your own analysis and invest based on your own insights.
23.93
+0.53 (+2.26%)
Find more stocks in the Stock Screener
ATAT Latest News and Analysis
 13 days ago - ChartmillShould you consider ATOUR LIFESTYLE HOLDINGS-ADR (NASDAQ:ATAT) for growth investing?
A fundamental analysis of (NASDAQ:ATAT): Should you consider ATOUR LIFESTYLE HOLDINGS-ADR (NASDAQ:ATAT) for growth investing?
 20 days ago - ChartmillIs ATOUR LIFESTYLE HOLDINGS-ADR (NASDAQ:ATAT) a Minervini-style stock?
A fundamental and technical analysis of (NASDAQ:ATAT): Why the high growth investor may take a look at ATOUR LIFESTYLE HOLDINGS-ADR (NASDAQ:ATAT).
