
When you look at ACADEMY SPORTS & OUTDOORS IN (NASDAQ:ASO), it's hard to ignore the strong fundamentals, especially considering its likely undervaluation.
By Mill Chart
Last update: Apr 2, 2025
Consider ACADEMY SPORTS & OUTDOORS IN (NASDAQ:ASO) as a top value stock, identified by our stock screening tool. ASO shines in terms of profitability, solvency, and liquidity, all while remaining very reasonably priced. Let's dive deeper into the analysis.
Valuation Analysis for ASO
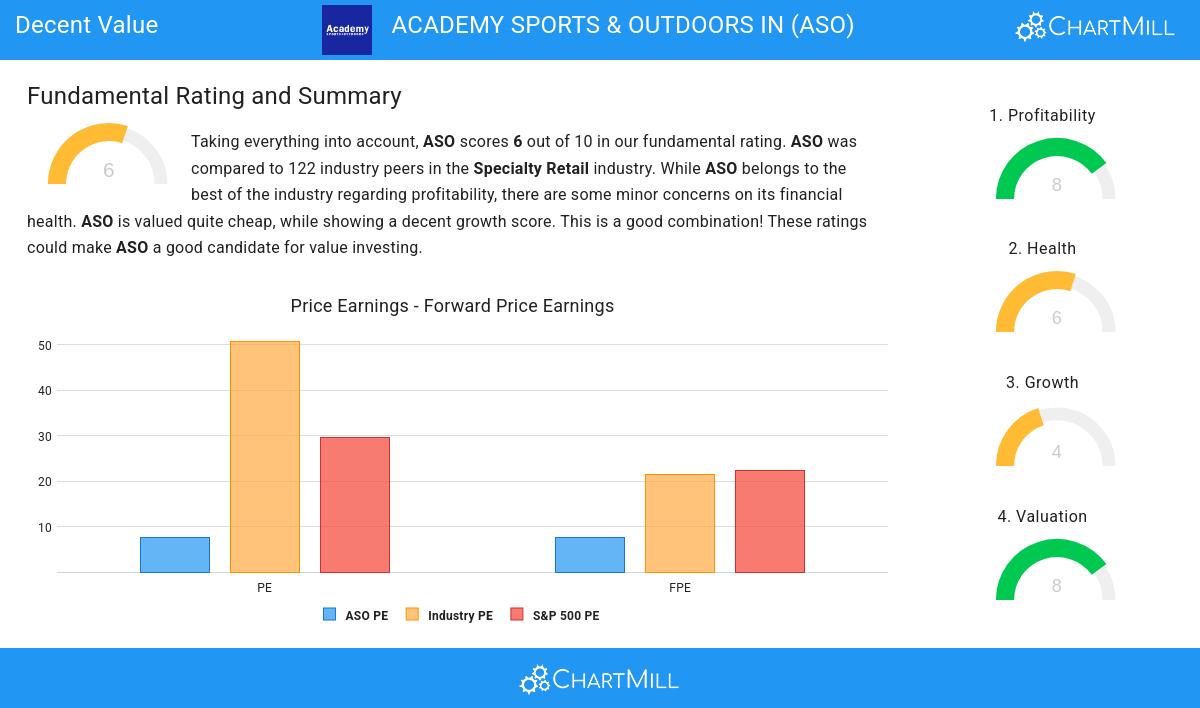
ChartMill assigns a proprietary Valuation Rating to each stock. The score is computed by evaluating various valuation aspects, like price to earnings and free cash flow, both absolutely as relative to the market and industry. ASO was assigned a score of 8 for valuation:
- The Price/Earnings ratio is 7.70, which indicates a rather cheap valuation of ASO.
- Based on the Price/Earnings ratio, ASO is valued cheaply inside the industry as 90.16% of the companies are valued more expensively.
- The average S&P500 Price/Earnings ratio is at 29.59. ASO is valued rather cheaply when compared to this.
- With a Price/Forward Earnings ratio of 7.61, the valuation of ASO can be described as very cheap.
- Based on the Price/Forward Earnings ratio, ASO is valued cheaply inside the industry as 89.34% of the companies are valued more expensively.
- ASO's Price/Forward Earnings ratio indicates a rather cheap valuation when compared to the S&P500 average which is at 22.36.
- Based on the Enterprise Value to EBITDA ratio, ASO is valued cheaper than 81.15% of the companies in the same industry.
- ASO's Price/Free Cash Flow ratio is rather cheap when compared to the industry. ASO is cheaper than 85.25% of the companies in the same industry.
- ASO has an outstanding profitability rating, which may justify a higher PE ratio.
Profitability Analysis for ASO
ChartMill utilizes a Profitability Rating to assess stocks, scoring them on a scale of 0 to 10. This rating takes into account a variety of profitability ratios and margins, both in absolute terms and in comparison to industry peers. ASO has earned a 8 out of 10:
- With an excellent Return On Assets value of 8.54%, ASO belongs to the best of the industry, outperforming 80.33% of the companies in the same industry.
- Looking at the Return On Equity, with a value of 20.88%, ASO is in the better half of the industry, outperforming 79.51% of the companies in the same industry.
- ASO has a better Return On Invested Capital (10.67%) than 72.95% of its industry peers.
- ASO has a better Profit Margin (7.05%) than 83.61% of its industry peers.
- In the last couple of years the Profit Margin of ASO has grown nicely.
- ASO has a better Operating Margin (9.08%) than 81.97% of its industry peers.
- ASO's Operating Margin has improved in the last couple of years.
- ASO's Gross Margin has improved in the last couple of years.
Unpacking ASO's Health Rating
ChartMill assigns a proprietary Health Rating to each stock. The score is computed by evaluating various liquidity and solvency ratios and ranges from 0 to 10. ASO was assigned a score of 6 for health:
- With a decent Altman-Z score value of 2.93, ASO is doing good in the industry, outperforming 70.49% of the companies in the same industry.
- ASO has a debt to FCF ratio of 1.48. This is a very positive value and a sign of high solvency as it would only need 1.48 years to pay back of all of its debts.
- ASO has a Debt to FCF ratio of 1.48. This is in the better half of the industry: ASO outperforms 74.59% of its industry peers.
- ASO has a Debt/Equity ratio of 0.24. This is a healthy value indicating a solid balance between debt and equity.
- Looking at the Debt to Equity ratio, with a value of 0.24, ASO is in the better half of the industry, outperforming 61.48% of the companies in the same industry.
- ASO's Current ratio of 1.78 is fine compared to the rest of the industry. ASO outperforms 75.41% of its industry peers.
Growth Assessment of ASO
ChartMill assigns a Growth Rating to each stock, ranging from 0 to 10. This rating is determined by analyzing different growth elements, including EPS and revenue growth, spanning both historical and future figures. In the case of ASO, the assigned 4 reflects its growth potential:
- Measured over the past years, ASO shows a very strong growth in Earnings Per Share. The EPS has been growing by 33.32% on average per year.
- When comparing the Revenue growth rate of the last years to the growth rate of the upcoming years, we see that the growth is accelerating.
Our Decent Value screener lists more Decent Value stocks and is updated daily.
For an up to date full fundamental analysis you can check the fundamental report of ASO
Keep in mind
This article should in no way be interpreted as advice. The article is based on the observed metrics at the time of writing, but you should always make your own analysis and trade or invest at your own responsibility.
NASDAQ:ASO (4/24/2025, 10:13:03 AM)
37.345
-0.27 (-0.7%)
Find more stocks in the Stock Screener
