
NASDAQ:ASO: good value for what you're paying.
By Mill Chart
Last update: Oct 18, 2024
ACADEMY SPORTS & OUTDOORS IN (NASDAQ:ASO) was identified as a decent value stock by our stock screener. NASDAQ:ASO scores well on profitability, solvency and liquidity. At the same time it seems to be priced very reasonably. We'll explore this a bit deeper below.
Understanding NASDAQ:ASO's Valuation
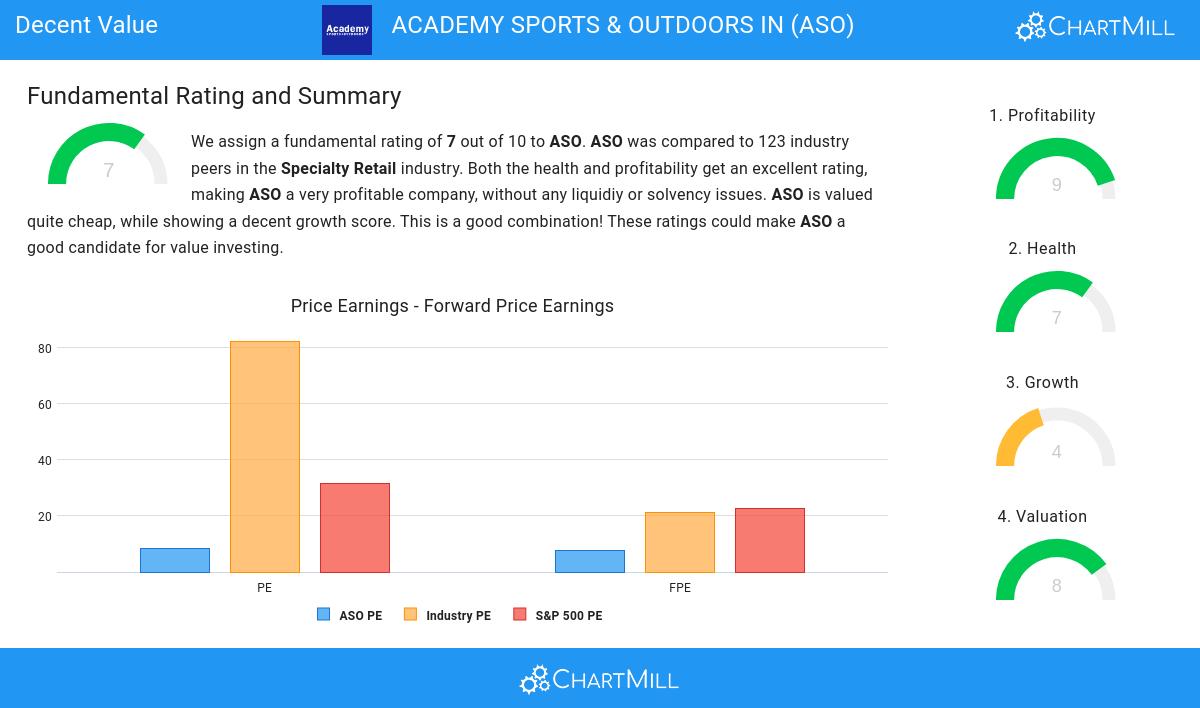
ChartMill provides a Valuation Rating to every stock, ranging from 0 to 10. This rating assesses various valuation aspects, comparing price to earnings and cash flows, while considering factors like profitability and growth. NASDAQ:ASO boasts a 8 out of 10:
- The Price/Earnings ratio is 8.27, which indicates a very decent valuation of ASO.
- 93.39% of the companies in the same industry are more expensive than ASO, based on the Price/Earnings ratio.
- Compared to an average S&P500 Price/Earnings ratio of 31.77, ASO is valued rather cheaply.
- A Price/Forward Earnings ratio of 7.67 indicates a rather cheap valuation of ASO.
- Compared to the rest of the industry, the Price/Forward Earnings ratio of ASO indicates a rather cheap valuation: ASO is cheaper than 93.39% of the companies listed in the same industry.
- Compared to an average S&P500 Price/Forward Earnings ratio of 22.70, ASO is valued rather cheaply.
- Based on the Enterprise Value to EBITDA ratio, ASO is valued cheaply inside the industry as 86.78% of the companies are valued more expensively.
- Based on the Price/Free Cash Flow ratio, ASO is valued cheaply inside the industry as 87.60% of the companies are valued more expensively.
- The excellent profitability rating of ASO may justify a higher PE ratio.
A Closer Look at Profitability for NASDAQ:ASO
ChartMill assigns a Profitability Rating to every stock. This score ranges from 0 to 10 and evaluates the different profitability ratios and margins, both absolutely, but also relative to the industry peers. NASDAQ:ASO scores a 9 out of 10:
- Looking at the Return On Assets, with a value of 10.00%, ASO belongs to the top of the industry, outperforming 84.30% of the companies in the same industry.
- ASO's Return On Equity of 24.95% is fine compared to the rest of the industry. ASO outperforms 78.51% of its industry peers.
- ASO has a better Return On Invested Capital (12.97%) than 82.64% of its industry peers.
- The Average Return On Invested Capital over the past 3 years for ASO is significantly above the industry average of 12.30%.
- The last Return On Invested Capital (12.97%) for ASO is well below the 3 year average (17.55%), which needs to be investigated, but indicates that ASO had better years and this may not be a problem.
- The Profit Margin of ASO (7.98%) is better than 85.95% of its industry peers.
- ASO's Profit Margin has improved in the last couple of years.
- The Operating Margin of ASO (10.37%) is better than 85.12% of its industry peers.
- In the last couple of years the Operating Margin of ASO has grown nicely.
- ASO's Gross Margin has improved in the last couple of years.
Health Assessment of NASDAQ:ASO
ChartMill assigns a proprietary Health Rating to each stock. The score is computed by evaluating various liquidity and solvency ratios and ranges from 0 to 10. NASDAQ:ASO was assigned a score of 7 for health:
- ASO has an Altman-Z score of 3.15. This indicates that ASO is financially healthy and has little risk of bankruptcy at the moment.
- ASO has a Altman-Z score of 3.15. This is in the better half of the industry: ASO outperforms 66.12% of its industry peers.
- ASO has a debt to FCF ratio of 1.18. This is a very positive value and a sign of high solvency as it would only need 1.18 years to pay back of all of its debts.
- The Debt to FCF ratio of ASO (1.18) is better than 76.86% of its industry peers.
- A Debt/Equity ratio of 0.25 indicates that ASO is not too dependend on debt financing.
- ASO's Current ratio of 1.66 is fine compared to the rest of the industry. ASO outperforms 68.59% of its industry peers.
- The current and quick ratio evaluation for ASO is rather negative, while it does have excellent solvency and profitability. These ratios do not necessarly indicate liquidity issues and need to be evaluated against the specifics of the business.
Evaluating Growth: NASDAQ:ASO
ChartMill assigns a proprietary Growth Rating to each stock. The score is computed by evaluating various growth aspects, like EPS and revenue growth. We take into account the history as well as the estimated future numbers. NASDAQ:ASO was assigned a score of 4 for growth:
- The Earnings Per Share has been growing by 94.62% on average over the past years. This is a very strong growth
- The Earnings Per Share is expected to grow by 10.51% on average over the next years. This is quite good.
Our Decent Value screener lists more Decent Value stocks and is updated daily.
For an up to date full fundamental analysis you can check the fundamental report of ASO
Keep in mind
This article should in no way be interpreted as advice. The article is based on the observed metrics at the time of writing, but you should always make your own analysis and trade or invest at your own responsibility.