
Despite its impressive fundamentals, NASDAQ:ASO remains undervalued.
By Mill Chart
Last update: Sep 26, 2024
Take a closer look at ACADEMY SPORTS & OUTDOORS IN (NASDAQ:ASO), a remarkable value stock uncovered by our stock screener. NASDAQ:ASO excels in fundamentals and maintains a very reasonable valuation. Let's break it down further.
Evaluating Valuation: NASDAQ:ASO
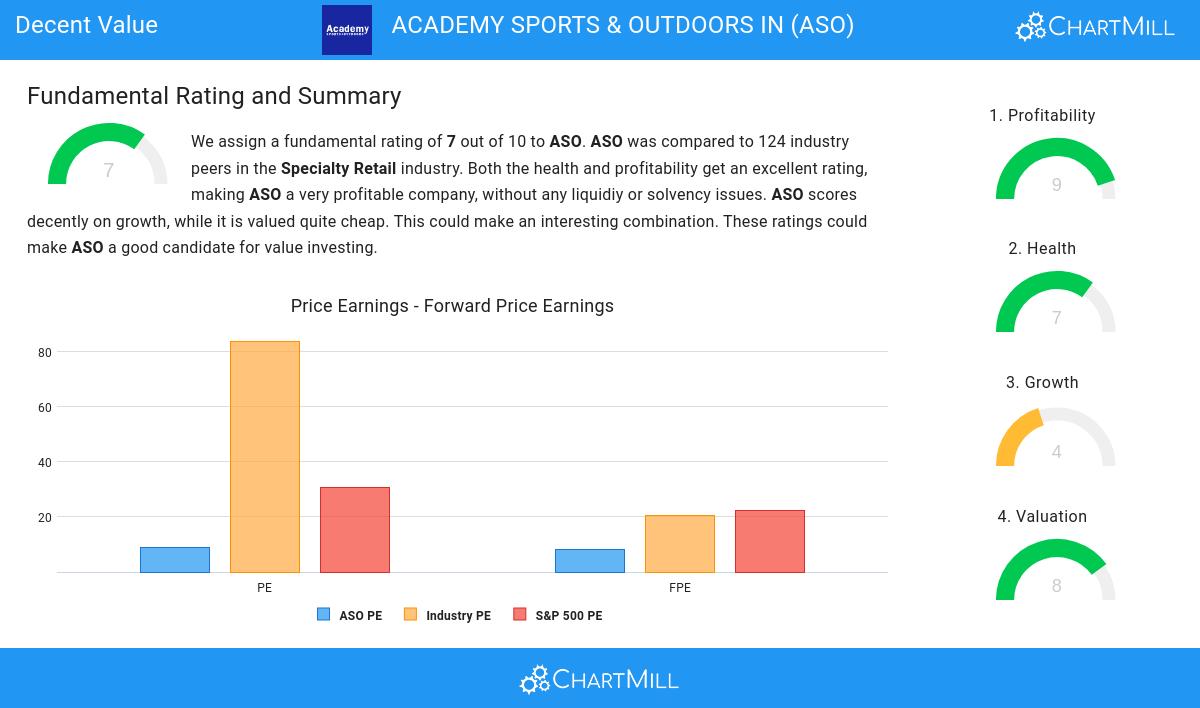
ChartMill assigns a proprietary Valuation Rating to each stock. The score is computed by evaluating various valuation aspects, like price to earnings and free cash flow, both absolutely as relative to the market and industry. NASDAQ:ASO was assigned a score of 8 for valuation:
- With a Price/Earnings ratio of 8.84, the valuation of ASO can be described as very reasonable.
- 92.62% of the companies in the same industry are more expensive than ASO, based on the Price/Earnings ratio.
- Compared to an average S&P500 Price/Earnings ratio of 30.63, ASO is valued rather cheaply.
- With a Price/Forward Earnings ratio of 8.20, the valuation of ASO can be described as very reasonable.
- Based on the Price/Forward Earnings ratio, ASO is valued cheaper than 90.16% of the companies in the same industry.
- Compared to an average S&P500 Price/Forward Earnings ratio of 22.19, ASO is valued rather cheaply.
- Based on the Enterprise Value to EBITDA ratio, ASO is valued cheaper than 82.79% of the companies in the same industry.
- Based on the Price/Free Cash Flow ratio, ASO is valued cheaply inside the industry as 82.79% of the companies are valued more expensively.
- The excellent profitability rating of ASO may justify a higher PE ratio.
Exploring NASDAQ:ASO's Profitability
ChartMill assigns a Profitability Rating to every stock. This score ranges from 0 to 10 and evaluates the different profitability ratios and margins, both absolutely, but also relative to the industry peers. NASDAQ:ASO scores a 9 out of 10:
- Looking at the Return On Assets, with a value of 10.00%, ASO belongs to the top of the industry, outperforming 83.61% of the companies in the same industry.
- ASO's Return On Equity of 24.95% is fine compared to the rest of the industry. ASO outperforms 77.87% of its industry peers.
- Looking at the Return On Invested Capital, with a value of 12.97%, ASO belongs to the top of the industry, outperforming 82.79% of the companies in the same industry.
- Measured over the past 3 years, the Average Return On Invested Capital for ASO is significantly above the industry average of 12.30%.
- The last Return On Invested Capital (12.97%) for ASO is well below the 3 year average (17.55%), which needs to be investigated, but indicates that ASO had better years and this may not be a problem.
- With an excellent Profit Margin value of 7.98%, ASO belongs to the best of the industry, outperforming 85.25% of the companies in the same industry.
- In the last couple of years the Profit Margin of ASO has grown nicely.
- ASO's Operating Margin of 10.37% is amongst the best of the industry. ASO outperforms 85.25% of its industry peers.
- In the last couple of years the Operating Margin of ASO has grown nicely.
- In the last couple of years the Gross Margin of ASO has grown nicely.
Assessing Health Metrics for NASDAQ:ASO
ChartMill employs a unique Health Rating system for all stocks. This rating, ranging from 0 to 10, is determined by analyzing various liquidity and solvency ratios. For NASDAQ:ASO, the assigned 7 for health provides valuable insights:
- ASO has an Altman-Z score of 3.20. This indicates that ASO is financially healthy and has little risk of bankruptcy at the moment.
- With a decent Altman-Z score value of 3.20, ASO is doing good in the industry, outperforming 68.03% of the companies in the same industry.
- ASO has a debt to FCF ratio of 1.18. This is a very positive value and a sign of high solvency as it would only need 1.18 years to pay back of all of its debts.
- ASO's Debt to FCF ratio of 1.18 is fine compared to the rest of the industry. ASO outperforms 77.05% of its industry peers.
- ASO has a Debt/Equity ratio of 0.25. This is a healthy value indicating a solid balance between debt and equity.
- ASO has a better Current ratio (1.66) than 69.67% of its industry peers.
- ASO does not score too well on the current and quick ratio evaluation. However, as it has excellent solvency and profitability, these ratios do not necessarly indicate liquidity issues and need to be evaluated against the specifics of the business.
Understanding NASDAQ:ASO's Growth Score
ChartMill assigns a Growth Rating to each stock, ranging from 0 to 10. This rating is determined by analyzing different growth elements, including EPS and revenue growth, spanning both historical and future figures. In the case of NASDAQ:ASO, the assigned 4 reflects its growth potential:
- Measured over the past years, ASO shows a very strong growth in Earnings Per Share. The EPS has been growing by 94.62% on average per year.
- ASO is expected to show quite a strong growth in Earnings Per Share. In the coming years, the EPS will grow by 10.51% yearly.
Every day, new Decent Value stocks can be found on ChartMill in our Decent Value screener.
For an up to date full fundamental analysis you can check the fundamental report of ASO
Disclaimer
Important Note: The content of this article is not intended as trading advice. It is essential to perform your own analysis and exercise caution when making trading decisions. The article presents observations created by automated analysis but does not guarantee any trading or investment outcomes. Always trade responsibly and make independent judgments.