
NASDAQ:ASO: good value for what you're paying.
By Mill Chart
Last update: Sep 5, 2024
Our stock screener has singled out ACADEMY SPORTS & OUTDOORS IN (NASDAQ:ASO) as a stellar value proposition. NASDAQ:ASO not only scores well in profitability, solvency, and liquidity but also maintains a very reasonable price point. We'll explore this further.
Assessing Valuation for NASDAQ:ASO
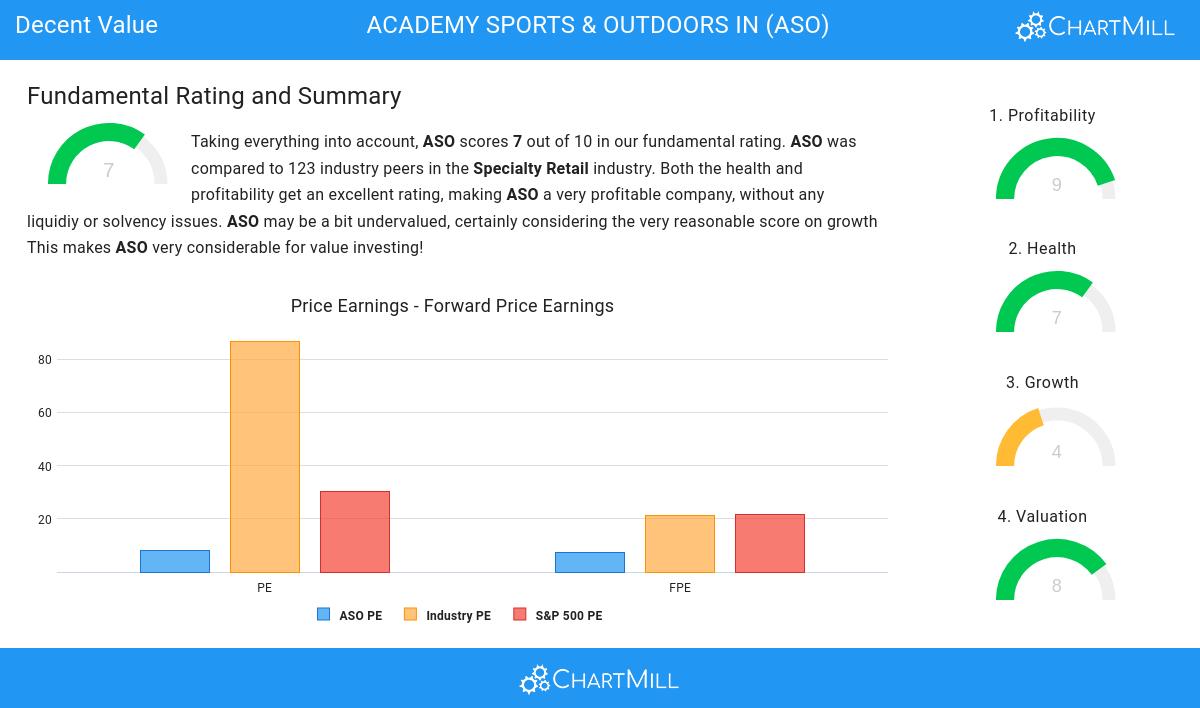
ChartMill employs its own Valuation Rating system for all stocks. This score, ranging from 0 to 10, is determined by evaluating different valuation factors, including price to earnings and free cash flow, both in absolute terms and relative to the market and industry. NASDAQ:ASO has earned a 8 for valuation:
- With a Price/Earnings ratio of 7.96, the valuation of ASO can be described as very cheap.
- 95.90% of the companies in the same industry are more expensive than ASO, based on the Price/Earnings ratio.
- Compared to an average S&P500 Price/Earnings ratio of 30.17, ASO is valued rather cheaply.
- ASO is valuated cheaply with a Price/Forward Earnings ratio of 7.45.
- Compared to the rest of the industry, the Price/Forward Earnings ratio of ASO indicates a rather cheap valuation: ASO is cheaper than 91.80% of the companies listed in the same industry.
- ASO is valuated cheaply when we compare the Price/Forward Earnings ratio to 21.56, which is the current average of the S&P500 Index.
- Based on the Enterprise Value to EBITDA ratio, ASO is valued cheaper than 86.89% of the companies in the same industry.
- Based on the Price/Free Cash Flow ratio, ASO is valued cheaply inside the industry as 89.34% of the companies are valued more expensively.
- ASO has an outstanding profitability rating, which may justify a higher PE ratio.
Understanding NASDAQ:ASO's Profitability
ChartMill's Profitability Rating offers a unique perspective on stock analysis, providing scores from 0 to 10. These ratings consider a wide range of profitability metrics and margins, both in comparison to industry peers and on their own merits. For NASDAQ:ASO, the assigned 9 is a significant indicator of profitability:
- With an excellent Return On Assets value of 10.29%, ASO belongs to the best of the industry, outperforming 84.43% of the companies in the same industry.
- ASO has a better Return On Equity (26.33%) than 81.97% of its industry peers.
- The Return On Invested Capital of ASO (13.51%) is better than 81.97% of its industry peers.
- ASO had an Average Return On Invested Capital over the past 3 years of 17.55%. This is significantly above the industry average of 12.51%.
- The last Return On Invested Capital (13.51%) for ASO is well below the 3 year average (17.55%), which needs to be investigated, but indicates that ASO had better years and this may not be a problem.
- The Profit Margin of ASO (8.17%) is better than 85.25% of its industry peers.
- ASO's Profit Margin has improved in the last couple of years.
- ASO's Operating Margin of 10.65% is amongst the best of the industry. ASO outperforms 86.07% of its industry peers.
- ASO's Operating Margin has improved in the last couple of years.
- In the last couple of years the Gross Margin of ASO has grown nicely.
ChartMill's Evaluation of Health
ChartMill employs its own Health Rating for stock assessment. This rating, ranging from 0 to 10, is calculated by examining various liquidity and solvency ratios. In the case of NASDAQ:ASO, the assigned 7 reflects its health status:
- An Altman-Z score of 3.14 indicates that ASO is not in any danger for bankruptcy at the moment.
- ASO has a Altman-Z score of 3.14. This is in the better half of the industry: ASO outperforms 72.13% of its industry peers.
- ASO has a debt to FCF ratio of 1.01. This is a very positive value and a sign of high solvency as it would only need 1.01 years to pay back of all of its debts.
- ASO's Debt to FCF ratio of 1.01 is fine compared to the rest of the industry. ASO outperforms 79.51% of its industry peers.
- A Debt/Equity ratio of 0.25 indicates that ASO is not too dependend on debt financing.
- ASO has a better Current ratio (1.62) than 65.57% of its industry peers.
- The current and quick ratio evaluation for ASO is rather negative, while it does have excellent solvency and profitability. These ratios do not necessarly indicate liquidity issues and need to be evaluated against the specifics of the business.
Growth Insights: NASDAQ:ASO
Every stock receives a Growth Rating from ChartMill, ranging from 0 to 10. This rating assesses various growth aspects, including historical and projected EPS and revenue growth. NASDAQ:ASO boasts a 4 out of 10:
- The Earnings Per Share has been growing by 94.62% on average over the past years. This is a very strong growth
- The Earnings Per Share is expected to grow by 10.51% on average over the next years. This is quite good.
More Decent Value stocks can be found in our Decent Value screener.
For an up to date full fundamental analysis you can check the fundamental report of ASO
Disclaimer
This is not investing advice! The article highlights some of the observations at the time of writing, but you should always make your own analysis and invest based on your own insights.