
Exploring the Growth Potential of NASDAQ:APP as It Nears a Breakout.
By Mill Chart
Last update: Feb 4, 2025
Growth investors are on the lookout for stocks displaying robust revenue and EPS growth. In this analysis, we'll assess whether APPLOVIN CORP-CLASS A (NASDAQ:APP) aligns with growth investing criteria, especially as it consolidates and signals a possible breakout. As always, investors should conduct their own research, but APPLOVIN CORP-CLASS A has surfaced on our radar for growth with base formation, warranting further examination.
Growth Analysis for NASDAQ:APP
A key component of ChartMill's stock assessment is the Growth Rating, which spans from 0 to 10. This rating evaluates diverse growth factors, such as EPS and revenue growth, considering both past performance and future projections. NASDAQ:APP has received a 8 out of 10:
- APP shows a strong growth in Earnings Per Share. In the last year, the EPS has been growing by 1000.00%, which is quite impressive.
- The Revenue has grown by 41.48% in the past year. This is a very strong growth!
- The Revenue has been growing by 46.69% on average over the past years. This is a very strong growth!
- The Earnings Per Share is expected to grow by 32.41% on average over the next years. This is a very strong growth
- APP is expected to show a strong growth in Revenue. In the coming years, the Revenue will grow by 26.61% yearly.
How do we evaluate the Health for NASDAQ:APP?
ChartMill assigns a proprietary Health Rating to each stock. The score is computed by evaluating various liquidity and solvency ratios and ranges from 0 to 10. NASDAQ:APP was assigned a score of 7 for health:
- APP has an Altman-Z score of 18.30. This indicates that APP is financially healthy and has little risk of bankruptcy at the moment.
- APP has a better Altman-Z score (18.30) than 92.42% of its industry peers.
- APP has a debt to FCF ratio of 2.01. This is a good value and a sign of high solvency as APP would need 2.01 years to pay back of all of its debts.
- Looking at the Debt to FCF ratio, with a value of 2.01, APP is in the better half of the industry, outperforming 66.06% of the companies in the same industry.
- Even though the debt/equity ratio score it not favorable for APP, it has very limited outstanding debt, so we won't put too much weight on the DE evaluation.
- APP has a Current Ratio of 2.41. This indicates that APP is financially healthy and has no problem in meeting its short term obligations.
- With a decent Current ratio value of 2.41, APP is doing good in the industry, outperforming 65.70% of the companies in the same industry.
- APP has a Quick Ratio of 2.41. This indicates that APP is financially healthy and has no problem in meeting its short term obligations.
- APP has a Quick ratio of 2.41. This is in the better half of the industry: APP outperforms 67.87% of its industry peers.
Assessing Profitability for NASDAQ:APP
ChartMill assigns a Profitability Rating to every stock. This score ranges from 0 to 10 and evaluates the different profitability ratios and margins, both absolutely, but also relative to the industry peers. NASDAQ:APP scores a 7 out of 10:
- APP has a Return On Assets of 21.13%. This is amongst the best in the industry. APP outperforms 96.75% of its industry peers.
- APP has a better Return On Equity (122.59%) than 99.28% of its industry peers.
- APP has a better Return On Invested Capital (26.01%) than 96.75% of its industry peers.
- The 3 year average ROIC (4.97%) for APP is below the current ROIC(26.01%), indicating increased profibility in the last year.
- With an excellent Profit Margin value of 26.81%, APP belongs to the best of the industry, outperforming 92.06% of the companies in the same industry.
- APP has a Operating Margin of 35.78%. This is amongst the best in the industry. APP outperforms 96.75% of its industry peers.
- APP has a better Gross Margin (73.89%) than 63.18% of its industry peers.
Why is NASDAQ:APP a setup?
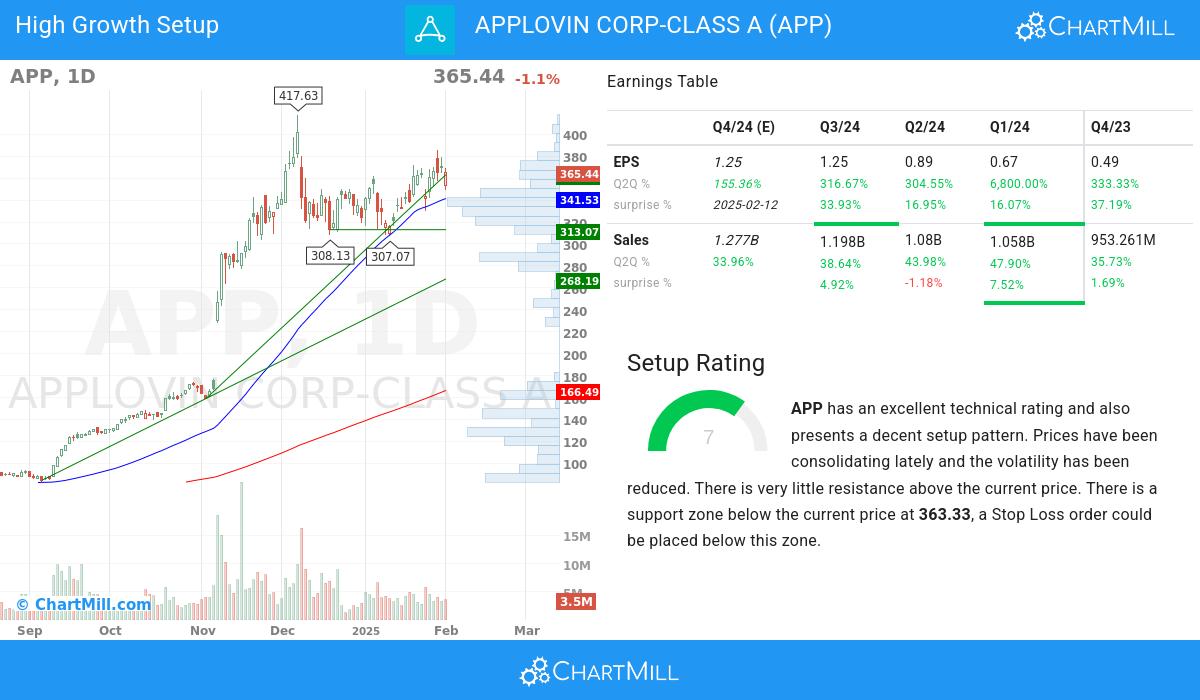
ChartMill also assign a Setup Rating to every stock. With this score it is determined to what extend the stock has been trading in a range in the recent days and weeks. This score also ranges from 0 to 10 and is updated daily. The setup score evaluates various short term technical indicators. NASDAQ:APP scores a 7 out of 10:
Besides having an excellent technical rating, APP also presents a decent setup pattern. We see reduced volatility while prices have been consolidating in the most recent period. There is very little resistance above the current price. There is a support zone below the current price at 363.33, a Stop Loss order could be placed below this zone.
Every day, new Strong Growth stocks can be found on ChartMill in our Strong Growth screener.
Our latest full fundamental report of APP contains the most current fundamental analsysis.
For an up to date full technical analysis you can check the technical report of APP
Keep in mind
This article should in no way be interpreted as advice. The article is based on the observed metrics at the time of writing, but you should always make your own analysis and trade or invest at your own responsibility.
238.22
+8.41 (+3.66%)
Find more stocks in the Stock Screener
APP Latest News and Analysis
 11 days ago - ChartmillAPPLOVIN CORP-CLASS A (NASDAQ:APP) is showing good growth, while it is not too expensive.
APPLOVIN CORP-CLASS A was identified as an affordable growth stock. NASDAQ:APP is showing great growth, but also scores well on profitability. At the same time it seems to be priced reasonably.
