Investors seeking growth at a reasonable cost should explore NASDAQ:APP.
By Mill Chart
Last update: Oct 9, 2024
APPLOVIN CORP-CLASS A (NASDAQ:APP) has caught the eye of our stock screener as an affordable growth stock. NASDAQ:APP is displaying robust growth metrics and also excels in terms of profitability, solvency, and liquidity. Additionally, it appears to be reasonably priced. Let's delve into the details.
Assessing Growth for NASDAQ:APP
ChartMill employs its own Growth Rating system for all stocks. This score, ranging from 0 to 10, is derived by evaluating different growth factors, such as EPS and revenue growth, taking into account both past performance and future projections. NASDAQ:APP has earned a 7 for growth:
- APP shows a strong growth in Earnings Per Share. In the last year, the EPS has been growing by 3816.67%, which is quite impressive.
- The Revenue has grown by 37.31% in the past year. This is a very strong growth!
- The Revenue has been growing by 46.69% on average over the past years. This is a very strong growth!
- APP is expected to show a strong growth in Earnings Per Share. In the coming years, the EPS will grow by 32.41% yearly.
- The Revenue is expected to grow by 14.27% on average over the next years. This is quite good.
Assessing Valuation Metrics for NASDAQ:APP
ChartMill assigns a proprietary Valuation Rating to each stock. The score is computed by evaluating various valuation aspects, like price to earnings and free cash flow, both absolutely as relative to the market and industry. NASDAQ:APP was assigned a score of 5 for valuation:
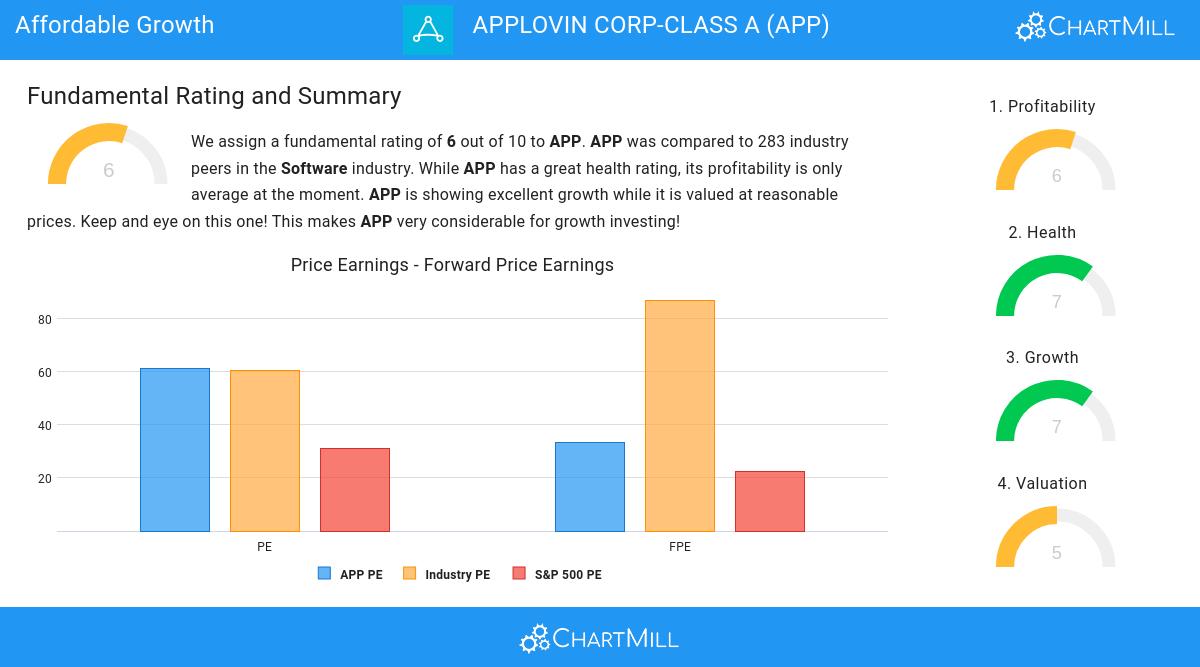
- Compared to the rest of the industry, the Price/Forward Earnings ratio of APP indicates a somewhat cheap valuation: APP is cheaper than 62.41% of the companies listed in the same industry.
- APP's Enterprise Value to EBITDA ratio is a bit cheaper when compared to the industry. APP is cheaper than 73.05% of the companies in the same industry.
- Based on the Price/Free Cash Flow ratio, APP is valued a bit cheaper than the industry average as 69.15% of the companies are valued more expensively.
- APP's low PEG Ratio(NY), which compensates the Price/Earnings for growth, indicates a rather cheap valuation of the company.
- APP has a very decent profitability rating, which may justify a higher PE ratio.
- APP's earnings are expected to grow with 72.18% in the coming years. This may justify a more expensive valuation.
Unpacking NASDAQ:APP's Health Rating
ChartMill employs a unique Health Rating system for all stocks. This rating, ranging from 0 to 10, is determined by analyzing various liquidity and solvency ratios. For NASDAQ:APP, the assigned 7 for health provides valuable insights:
- An Altman-Z score of 8.11 indicates that APP is not in any danger for bankruptcy at the moment.
- APP has a better Altman-Z score (8.11) than 78.72% of its industry peers.
- APP has a debt to FCF ratio of 2.52. This is a good value and a sign of high solvency as APP would need 2.52 years to pay back of all of its debts.
- APP has a Debt to FCF ratio of 2.52. This is in the better half of the industry: APP outperforms 64.89% of its industry peers.
- A Current Ratio of 2.28 indicates that APP has no problem at all paying its short term obligations.
- APP has a better Current ratio (2.28) than 63.83% of its industry peers.
- APP has a Quick Ratio of 2.28. This indicates that APP is financially healthy and has no problem in meeting its short term obligations.
- The Quick ratio of APP (2.28) is better than 65.25% of its industry peers.
Profitability Assessment of NASDAQ:APP
ChartMill employs its own Profitability Rating system for stock evaluation. This score, ranging from 0 to 10, is derived from an analysis of diverse profitability metrics and margins. In the case of NASDAQ:APP, the assigned 6 is noteworthy for profitability:
- With an excellent Return On Assets value of 15.63%, APP belongs to the best of the industry, outperforming 92.91% of the companies in the same industry.
- The Return On Equity of APP (101.08%) is better than 98.94% of its industry peers.
- APP's Return On Invested Capital of 21.13% is amongst the best of the industry. APP outperforms 95.74% of its industry peers.
- The last Return On Invested Capital (21.13%) for APP is above the 3 year average (4.97%), which is a sign of increasing profitability.
- The Profit Margin of APP (20.82%) is better than 88.30% of its industry peers.
- Looking at the Operating Margin, with a value of 30.69%, APP belongs to the top of the industry, outperforming 96.45% of the companies in the same industry.
Our Affordable Growth screener lists more Affordable Growth stocks and is updated daily.
For an up to date full fundamental analysis you can check the fundamental report of APP
Keep in mind
This article should in no way be interpreted as advice. The article is based on the observed metrics at the time of writing, but you should always make your own analysis and trade or invest at your own responsibility.
NASDAQ:APP (4/17/2025, 10:44:09 AM)
233.05
+3.24 (+1.41%)
Find more stocks in the Stock Screener
APP Latest News and Analysis
 10 days ago - ChartmillAPPLOVIN CORP-CLASS A (NASDAQ:APP) is showing good growth, while it is not too expensive.
APPLOVIN CORP-CLASS A was identified as an affordable growth stock. NASDAQ:APP is showing great growth, but also scores well on profitability. At the same time it seems to be priced reasonably.
