
When you look at NASDAQ:APA, it's hard to ignore the strong fundamentals, especially considering its likely undervaluation.
By Mill Chart
Last update: Oct 29, 2024
Our stock screening tool has pinpointed APA CORP (NASDAQ:APA) as an undervalued stock option. NASDAQ:APA retains a strong financial foundation and an attractive price tag. Let's delve into the specifics below.
Valuation Analysis for NASDAQ:APA
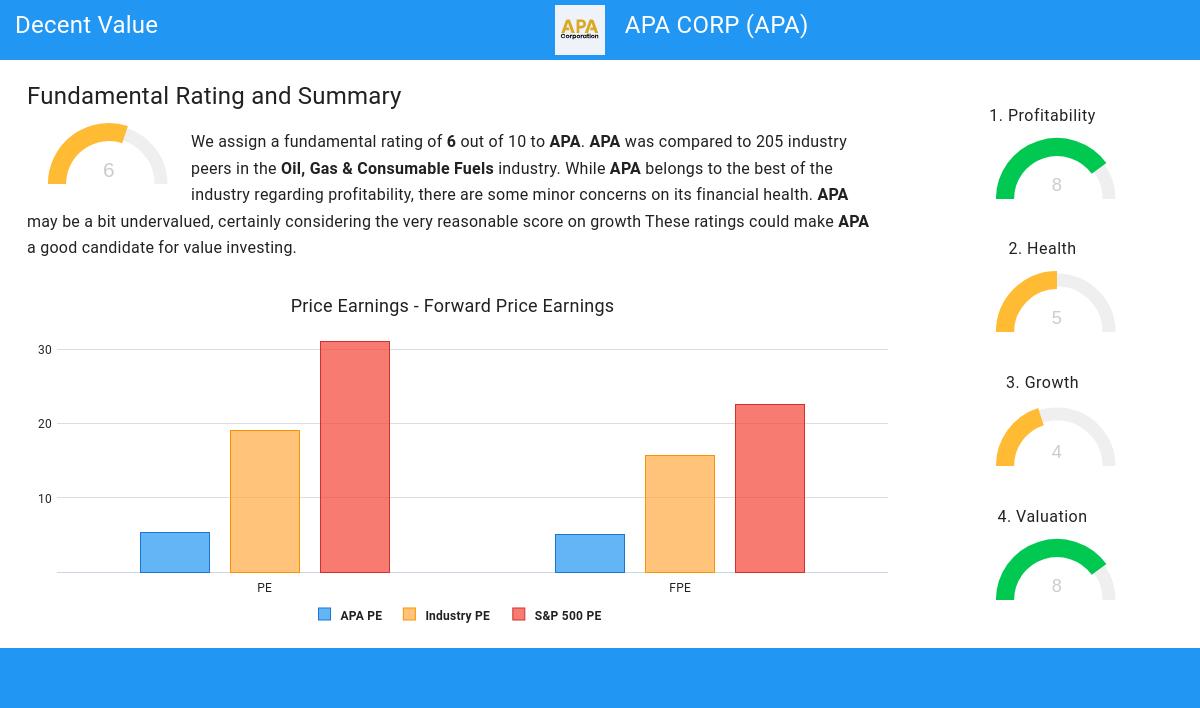
To assess a stock's valuation, ChartMill utilizes a Valuation Rating on a scale of 0 to 10. This comprehensive assessment considers various valuation aspects, comparing price to earnings and cash flows, while factoring in profitability and growth. NASDAQ:APA has achieved a 8 out of 10:
- A Price/Earnings ratio of 5.35 indicates a rather cheap valuation of APA.
- 86.76% of the companies in the same industry are more expensive than APA, based on the Price/Earnings ratio.
- APA is valuated cheaply when we compare the Price/Earnings ratio to 31.09, which is the current average of the S&P500 Index.
- With a Price/Forward Earnings ratio of 5.08, the valuation of APA can be described as very cheap.
- APA's Price/Forward Earnings ratio is rather cheap when compared to the industry. APA is cheaper than 85.29% of the companies in the same industry.
- When comparing the Price/Forward Earnings ratio of APA to the average of the S&P500 Index (22.57), we can say APA is valued rather cheaply.
- APA's Enterprise Value to EBITDA ratio is rather cheap when compared to the industry. APA is cheaper than 88.24% of the companies in the same industry.
- APA's Price/Free Cash Flow ratio is rather cheap when compared to the industry. APA is cheaper than 93.14% of the companies in the same industry.
- APA has an outstanding profitability rating, which may justify a higher PE ratio.
Exploring NASDAQ:APA's Profitability
ChartMill's Profitability Rating offers a unique perspective on stock analysis, providing scores from 0 to 10. These ratings consider a wide range of profitability metrics and margins, both in comparison to industry peers and on their own merits. For NASDAQ:APA, the assigned 8 is a significant indicator of profitability:
- The Return On Assets of APA (14.38%) is better than 85.29% of its industry peers.
- Looking at the Return On Equity, with a value of 53.57%, APA belongs to the top of the industry, outperforming 93.14% of the companies in the same industry.
- APA has a better Return On Invested Capital (13.75%) than 77.94% of its industry peers.
- The last Return On Invested Capital (13.75%) for APA is well below the 3 year average (23.87%), which needs to be investigated, but indicates that APA had better years and this may not be a problem.
- APA has a Profit Margin of 32.39%. This is in the better half of the industry: APA outperforms 79.41% of its industry peers.
- APA's Profit Margin has improved in the last couple of years.
- With a decent Operating Margin value of 37.26%, APA is doing good in the industry, outperforming 73.53% of the companies in the same industry.
- APA's Operating Margin has improved in the last couple of years.
- APA has a Gross Margin of 74.13%. This is amongst the best in the industry. APA outperforms 82.84% of its industry peers.
Understanding NASDAQ:APA's Health
A critical element of ChartMill's stock evaluation is the Health Rating, which spans from 0 to 10. This rating considers multiple health factors, including liquidity and solvency, both in absolute terms and relative to industry peers. NASDAQ:APA has received a 5 out of 10:
- The Debt to FCF ratio of APA is 2.38, which is a good value as it means it would take APA, 2.38 years of fcf income to pay off all of its debts.
- APA's Debt to FCF ratio of 2.38 is fine compared to the rest of the industry. APA outperforms 74.02% of its industry peers.
- Although APA does not score too well on debt/equity it has very limited outstanding debt, which is well covered by the FCF. We will not put too much weight on the debt/equity number as it may be because of low equity, which could be a consequence of a share buyback program for instance. This needs to be investigated.
Growth Insights: NASDAQ:APA
To evaluate a stock's growth potential, ChartMill utilizes a Growth Rating on a scale of 0 to 10. This comprehensive assessment considers various growth aspects, including historical and estimated EPS and revenue growth. NASDAQ:APA has achieved a 4 out of 10:
- APA shows a strong growth in Earnings Per Share. Measured over the last years, the EPS has been growing by 20.76% yearly.
- The Revenue growth rate is accelerating: in the next years the growth will be better than in the last years.
More Decent Value stocks can be found in our Decent Value screener.
Our latest full fundamental report of APA contains the most current fundamental analsysis.
Keep in mind
This article should in no way be interpreted as advice. The article is based on the observed metrics at the time of writing, but you should always make your own analysis and trade or invest at your own responsibility.
16.11
+0.74 (+4.81%)
Find more stocks in the Stock Screener
APA Latest News and Analysis
 14 hours ago - ChartmillStay informed with the top movers within the S&P500 index on Thursday.
Stay updated with the movement of S&P500 stocks in today's session. Discover which S&P500 stocks are making waves on Thursday.
17 hours ago - ChartmillWhat's going on in today's session: S&P500 moversStay updated with the movement of S&P500 stocks in today's session. Discover which S&P500 stocks are making waves on Thursday.
2 days ago - ChartmillStay informed with the top movers within the S&P500 index on Wednesday.Let's delve into the developments on the US markets one hour before the close of the markets on Wednesday. Below, you'll find the top gainers and losers within the S&P500 index during today's session.
2 days ago - ChartmillDiscover which S&P500 stocks are making waves on Wednesday.Let's delve into the developments on the US markets in the middle of the day on Wednesday. Below, you'll find the top gainers and losers within the S&P500 index during today's session.
8 days ago - ChartmillTop S&P500 movers in Thursday's sessionLet's have a look at what is happening on the US markets one hour before the close of the markets on Thursday. Below you can find the top S&P500 gainers and losers in today's session.
8 days ago - ChartmillWhat's going on in today's session: S&P500 moversStay updated with the movements of the S&P500 index in the middle of the day on Thursday. Discover which stocks are leading as top gainers and losers in today's session.
 8 days ago - ChartmillGapping S&P500 stocks in Thursday's session
Let's take a look at the S&P500 stocks that are experiencing notable price gaps in today's session on Thursday. Discover the gap up and gap down stocks in the S&P500 index.
9 days ago - ChartmillThese S&P500 stocks are moving in today's sessionGet insights into the S&P500 index performance on Wednesday. Explore the top gainers and losers within the S&P500 index in today's session.
 9 days ago - ChartmillStay updated with the S&P500 stocks that are on the move in today's pre-market session.
Before the opening bell on Wednesday, let's take a glimpse of the US markets and explore the S&P500 top gainers and losers in today's pre-market session.
10 days ago - ChartmillTuesday's session: top gainers and losers in the S&P500 indexCurious about the top performers within the S&P500 index one hour before the close of the markets on Tuesday? Dive into the list of today's session's top gainers and losers for a comprehensive overview.
10 days ago - ChartmillExplore the top gainers and losers within the S&P500 index in today's session.Curious about the top performers within the S&P500 index in the middle of the day on Tuesday? Dive into the list of today's session's top gainers and losers for a comprehensive overview.
14 days ago - ChartmillDiscover which S&P500 stocks are making waves on Friday.Stay informed about the performance of the S&P500 index one hour before the close of the markets on Friday. Uncover the top gainers and losers in today's session for valuable insights.
