
Our stock screening tool has identified APA CORP (NASDAQ:APA) as an undervalued gem with strong fundamentals. NASDAQ:APA boasts decent financial health and profitability while maintaining an attractive price point. We'll break it down further.
Assessing Valuation Metrics for NASDAQ:APA
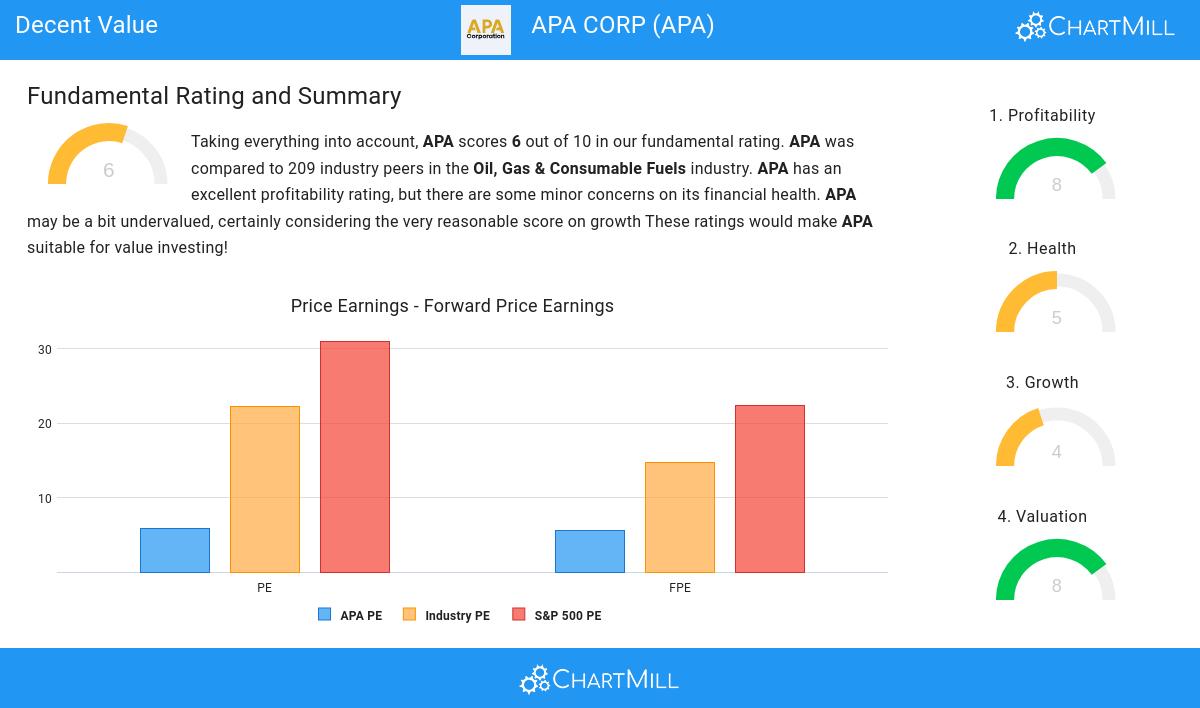
ChartMill assigns a proprietary Valuation Rating to each stock. The score is computed by evaluating various valuation aspects, like price to earnings and free cash flow, both absolutely as relative to the market and industry. NASDAQ:APA was assigned a score of 8 for valuation:
- The Price/Earnings ratio is 5.81, which indicates a rather cheap valuation of APA.
- Compared to the rest of the industry, the Price/Earnings ratio of APA indicates a rather cheap valuation: APA is cheaper than 85.65% of the companies listed in the same industry.
- Compared to an average S&P500 Price/Earnings ratio of 31.01, APA is valued rather cheaply.
- Based on the Price/Forward Earnings ratio of 5.53, the valuation of APA can be described as very cheap.
- Based on the Price/Forward Earnings ratio, APA is valued cheaply inside the industry as 85.65% of the companies are valued more expensively.
- Compared to an average S&P500 Price/Forward Earnings ratio of 22.36, APA is valued rather cheaply.
- Based on the Enterprise Value to EBITDA ratio, APA is valued cheaper than 89.00% of the companies in the same industry.
- 92.82% of the companies in the same industry are more expensive than APA, based on the Price/Free Cash Flow ratio.
- The excellent profitability rating of APA may justify a higher PE ratio.
Analyzing Profitability Metrics
ChartMill's Profitability Rating offers a unique perspective on stock analysis, providing scores from 0 to 10. These ratings consider a wide range of profitability metrics and margins, both in comparison to industry peers and on their own merits. For NASDAQ:APA, the assigned 8 is a significant indicator of profitability:
- APA has a better Return On Assets (14.38%) than 85.65% of its industry peers.
- APA has a better Return On Equity (53.57%) than 93.30% of its industry peers.
- APA has a better Return On Invested Capital (13.75%) than 78.47% of its industry peers.
- The last Return On Invested Capital (13.75%) for APA is well below the 3 year average (23.87%), which needs to be investigated, but indicates that APA had better years and this may not be a problem.
- APA has a better Profit Margin (32.39%) than 79.90% of its industry peers.
- In the last couple of years the Profit Margin of APA has grown nicely.
- APA has a Operating Margin of 37.26%. This is in the better half of the industry: APA outperforms 74.16% of its industry peers.
- APA's Operating Margin has improved in the last couple of years.
- APA's Gross Margin of 74.13% is amongst the best of the industry. APA outperforms 82.78% of its industry peers.
What does the Health looks like for NASDAQ:APA
ChartMill employs a unique Health Rating system for all stocks. This rating, ranging from 0 to 10, is determined by analyzing various liquidity and solvency ratios. For NASDAQ:APA, the assigned 5 for health provides valuable insights:
- The Debt to FCF ratio of APA is 2.38, which is a good value as it means it would take APA, 2.38 years of fcf income to pay off all of its debts.
- Looking at the Debt to FCF ratio, with a value of 2.38, APA is in the better half of the industry, outperforming 74.64% of the companies in the same industry.
- Even though the debt/equity ratio score it not favorable for APA, it has very limited outstanding debt, so we won't put too much weight on the DE evaluation.
Growth Examination for NASDAQ:APA
A key component of ChartMill's stock assessment is the Growth Rating, which spans from 0 to 10. This rating evaluates diverse growth factors, such as EPS and revenue growth, considering both past performance and future projections. NASDAQ:APA has received a 4 out of 10:
- The Earnings Per Share has been growing by 20.76% on average over the past years. This is a very strong growth
- When comparing the Revenue growth rate of the last years to the growth rate of the upcoming years, we see that the growth is accelerating.
Our Decent Value screener lists more Decent Value stocks and is updated daily.
Check the latest full fundamental report of APA for a complete fundamental analysis.
Disclaimer
This article should in no way be interpreted as advice. The article is based on the observed metrics at the time of writing, but you should always make your own analysis and trade or invest at your own responsibility.


