
NASDAQ:APA appears to be flying under the radar despite its strong fundamentals.
By Mill Chart
Last update: Sep 12, 2024
Our stock screening tool has identified APA CORP (NASDAQ:APA) as an undervalued gem with strong fundamentals. NASDAQ:APA boasts decent financial health and profitability while maintaining an attractive price point. We'll break it down further.
Deciphering NASDAQ:APA's Valuation Rating
An integral part of ChartMill's stock analysis is the Valuation Rating, which spans from 0 to 10. This rating evaluates diverse valuation factors, including price to earnings and cash flows, while considering the stock's profitability and growth. NASDAQ:APA has received a 8 out of 10:
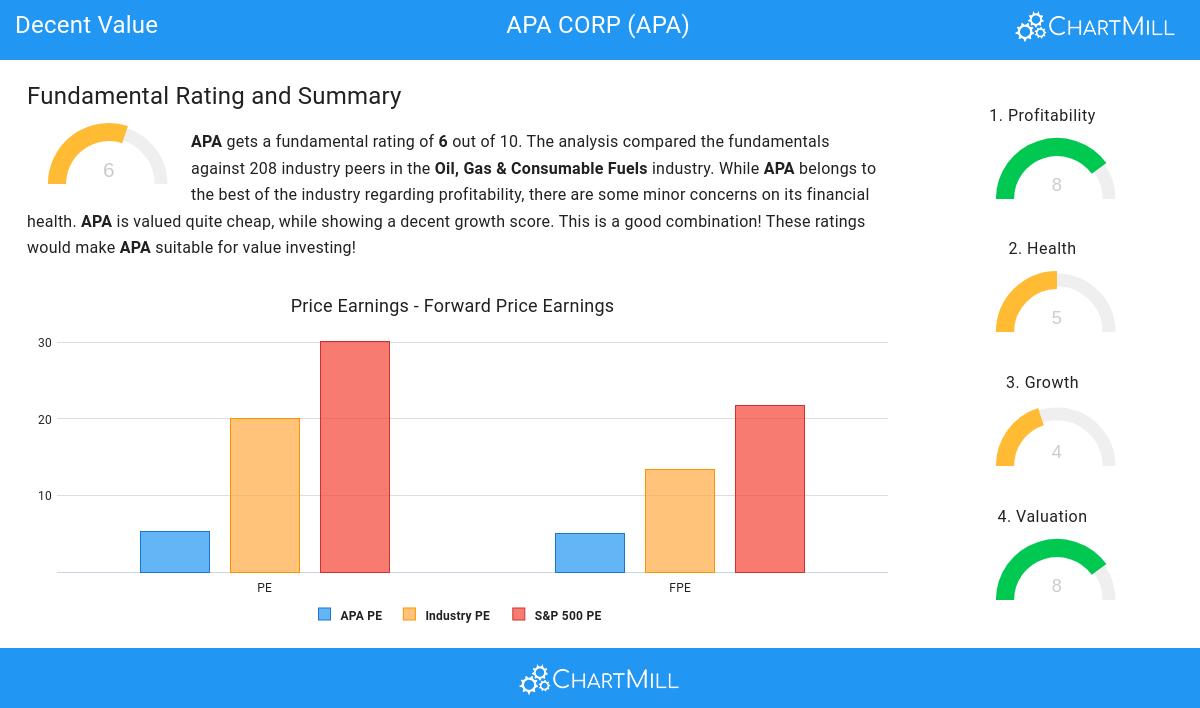
- The Price/Earnings ratio is 5.33, which indicates a rather cheap valuation of APA.
- APA's Price/Earnings ratio is rather cheap when compared to the industry. APA is cheaper than 86.54% of the companies in the same industry.
- The average S&P500 Price/Earnings ratio is at 30.15. APA is valued rather cheaply when compared to this.
- With a Price/Forward Earnings ratio of 5.07, the valuation of APA can be described as very cheap.
- Based on the Price/Forward Earnings ratio, APA is valued cheaper than 87.50% of the companies in the same industry.
- APA is valuated cheaply when we compare the Price/Forward Earnings ratio to 21.77, which is the current average of the S&P500 Index.
- Based on the Enterprise Value to EBITDA ratio, APA is valued cheaply inside the industry as 88.46% of the companies are valued more expensively.
- Based on the Price/Free Cash Flow ratio, APA is valued cheaper than 94.23% of the companies in the same industry.
- The excellent profitability rating of APA may justify a higher PE ratio.
Profitability Insights: NASDAQ:APA
ChartMill utilizes a Profitability Rating to assess stocks, scoring them on a scale of 0 to 10. This rating takes into account a variety of profitability ratios and margins, both in absolute terms and in comparison to industry peers. NASDAQ:APA has earned a 8 out of 10:
- APA's Return On Assets of 14.38% is amongst the best of the industry. APA outperforms 86.06% of its industry peers.
- Looking at the Return On Equity, with a value of 53.57%, APA belongs to the top of the industry, outperforming 93.75% of the companies in the same industry.
- APA has a Return On Invested Capital of 13.75%. This is in the better half of the industry: APA outperforms 78.85% of its industry peers.
- The 3 year average ROIC (23.87%) for APA is well above the current ROIC(13.75%). The reason for the recent decline needs to be investigated.
- APA has a Profit Margin of 32.39%. This is amongst the best in the industry. APA outperforms 80.29% of its industry peers.
- In the last couple of years the Profit Margin of APA has grown nicely.
- The Operating Margin of APA (37.26%) is better than 74.52% of its industry peers.
- APA's Operating Margin has improved in the last couple of years.
- APA has a Gross Margin of 74.13%. This is amongst the best in the industry. APA outperforms 82.69% of its industry peers.
How do we evaluate the Health for NASDAQ:APA?
To gauge a stock's financial health, ChartMill utilizes a Health Rating on a scale of 0 to 10. This comprehensive evaluation encompasses liquidity and solvency, both in absolute terms and in comparison to industry peers. NASDAQ:APA has earned a 5 out of 10:
- The Debt to FCF ratio of APA is 2.38, which is a good value as it means it would take APA, 2.38 years of fcf income to pay off all of its debts.
- APA has a better Debt to FCF ratio (2.38) than 75.00% of its industry peers.
- Even though the debt/equity ratio score it not favorable for APA, it has very limited outstanding debt, so we won't put too much weight on the DE evaluation.
Growth Assessment of NASDAQ:APA
ChartMill assigns a proprietary Growth Rating to each stock. The score is computed by evaluating various growth aspects, like EPS and revenue growth. We take into account the history as well as the estimated future numbers. NASDAQ:APA was assigned a score of 4 for growth:
- The Earnings Per Share has been growing by 20.76% on average over the past years. This is a very strong growth
- When comparing the Revenue growth rate of the last years to the growth rate of the upcoming years, we see that the growth is accelerating.
More Decent Value stocks can be found in our Decent Value screener.
For an up to date full fundamental analysis you can check the fundamental report of APA
Disclaimer
This is not investing advice! The article highlights some of the observations at the time of writing, but you should always make your own analysis and invest based on your own insights.
16.26
+0.61 (+3.9%)
Find more stocks in the Stock Screener
APA Latest News and Analysis
 3 days ago - ChartmillDiscover which S&P500 stocks are making waves on Monday.
Curious about the S&P500 stocks that are in motion on Monday? Join us as we explore the top movers within the S&P500 index during today's session.
7 days ago - ChartmillStay informed with the top movers within the S&P500 index on Thursday.Stay updated with the movement of S&P500 stocks in today's session. Discover which S&P500 stocks are making waves on Thursday.
7 days ago - ChartmillWhat's going on in today's session: S&P500 moversStay updated with the movement of S&P500 stocks in today's session. Discover which S&P500 stocks are making waves on Thursday.
8 days ago - ChartmillStay informed with the top movers within the S&P500 index on Wednesday.Let's delve into the developments on the US markets one hour before the close of the markets on Wednesday. Below, you'll find the top gainers and losers within the S&P500 index during today's session.
8 days ago - ChartmillDiscover which S&P500 stocks are making waves on Wednesday.Let's delve into the developments on the US markets in the middle of the day on Wednesday. Below, you'll find the top gainers and losers within the S&P500 index during today's session.
14 days ago - ChartmillTop S&P500 movers in Thursday's sessionLet's have a look at what is happening on the US markets one hour before the close of the markets on Thursday. Below you can find the top S&P500 gainers and losers in today's session.
14 days ago - ChartmillWhat's going on in today's session: S&P500 moversStay updated with the movements of the S&P500 index in the middle of the day on Thursday. Discover which stocks are leading as top gainers and losers in today's session.
 14 days ago - ChartmillGapping S&P500 stocks in Thursday's session
Let's take a look at the S&P500 stocks that are experiencing notable price gaps in today's session on Thursday. Discover the gap up and gap down stocks in the S&P500 index.
15 days ago - ChartmillThese S&P500 stocks are moving in today's sessionGet insights into the S&P500 index performance on Wednesday. Explore the top gainers and losers within the S&P500 index in today's session.
 16 days ago - ChartmillStay updated with the S&P500 stocks that are on the move in today's pre-market session.
Before the opening bell on Wednesday, let's take a glimpse of the US markets and explore the S&P500 top gainers and losers in today's pre-market session.
16 days ago - ChartmillTuesday's session: top gainers and losers in the S&P500 indexCurious about the top performers within the S&P500 index one hour before the close of the markets on Tuesday? Dive into the list of today's session's top gainers and losers for a comprehensive overview.
16 days ago - ChartmillExplore the top gainers and losers within the S&P500 index in today's session.Curious about the top performers within the S&P500 index in the middle of the day on Tuesday? Dive into the list of today's session's top gainers and losers for a comprehensive overview.
