
NYSE:ANF is probably undervalued for the fundamentals it is displaying.
By Mill Chart
Last update: Jan 27, 2025
Our stock screener has spotted ABERCROMBIE & FITCH CO-CL A (NYSE:ANF) as an undervalued stock with solid fundamentals. NYSE:ANF shows decent health and profitability. At the same time it remains remains attractively priced. We'll dive into each aspect below.
Evaluating Valuation: NYSE:ANF
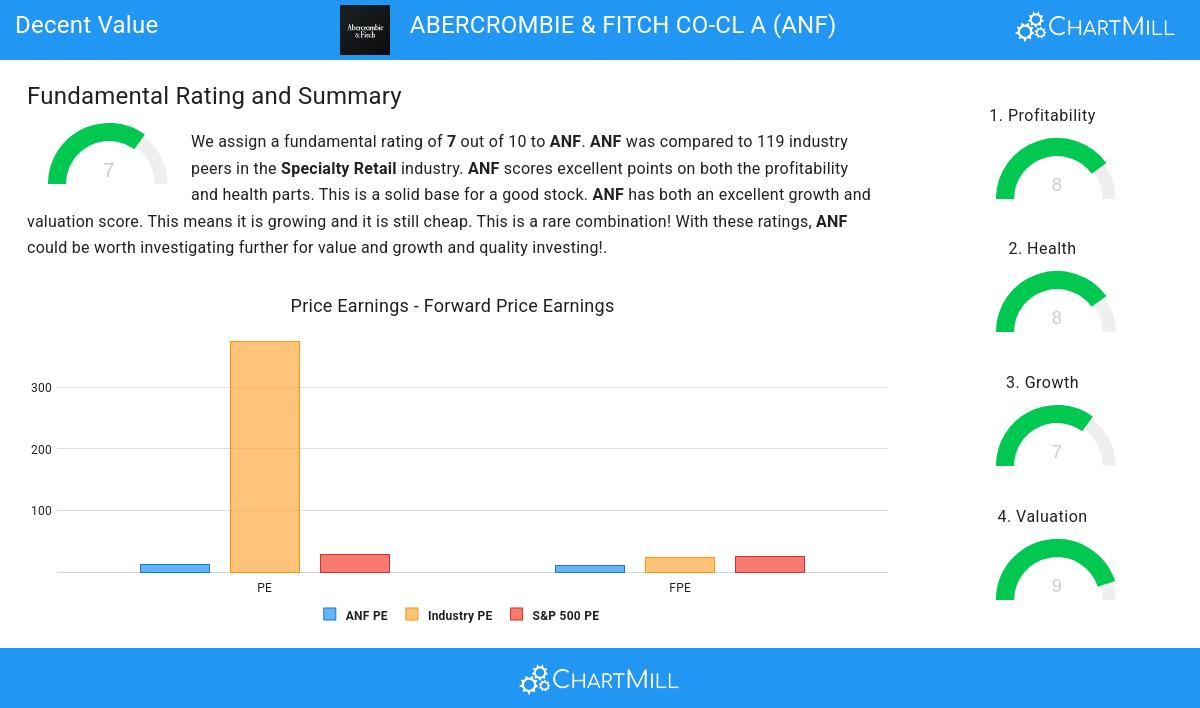
An integral part of ChartMill's stock analysis is the Valuation Rating, which spans from 0 to 10. This rating evaluates diverse valuation factors, including price to earnings and cash flows, while considering the stock's profitability and growth. NYSE:ANF has received a 9 out of 10:
- Based on the Price/Earnings ratio, ANF is valued cheaply inside the industry as 81.90% of the companies are valued more expensively.
- The average S&P500 Price/Earnings ratio is at 28.58. ANF is valued rather cheaply when compared to this.
- A Price/Forward Earnings ratio of 11.25 indicates a reasonable valuation of ANF.
- Compared to the rest of the industry, the Price/Forward Earnings ratio of ANF indicates a rather cheap valuation: ANF is cheaper than 80.17% of the companies listed in the same industry.
- The average S&P500 Price/Forward Earnings ratio is at 24.47. ANF is valued rather cheaply when compared to this.
- Based on the Enterprise Value to EBITDA ratio, ANF is valued cheaper than 83.62% of the companies in the same industry.
- Compared to the rest of the industry, the Price/Free Cash Flow ratio of ANF indicates a rather cheap valuation: ANF is cheaper than 85.34% of the companies listed in the same industry.
- The low PEG Ratio(NY), which compensates the Price/Earnings for growth, indicates a rather cheap valuation of the company.
- ANF has an outstanding profitability rating, which may justify a higher PE ratio.
- ANF's earnings are expected to grow with 25.74% in the coming years. This may justify a more expensive valuation.
Looking at the Profitability
Discover ChartMill's exclusive Profitability Rating, a proprietary metric that assesses stocks on a scale of 0 to 10. It takes into consideration various profitability ratios and margins, both in absolute terms and relative to industry peers. Notably, NYSE:ANF has achieved a 8:
- ANF has a Return On Assets of 16.45%. This is amongst the best in the industry. ANF outperforms 94.83% of its industry peers.
- ANF has a better Return On Equity (41.58%) than 92.24% of its industry peers.
- Looking at the Return On Invested Capital, with a value of 26.56%, ANF belongs to the top of the industry, outperforming 93.97% of the companies in the same industry.
- The 3 year average ROIC (12.86%) for ANF is below the current ROIC(26.56%), indicating increased profibility in the last year.
- Looking at the Profit Margin, with a value of 10.76%, ANF belongs to the top of the industry, outperforming 93.97% of the companies in the same industry.
- In the last couple of years the Profit Margin of ANF has grown nicely.
- Looking at the Operating Margin, with a value of 14.40%, ANF belongs to the top of the industry, outperforming 93.10% of the companies in the same industry.
- In the last couple of years the Operating Margin of ANF has grown nicely.
- ANF's Gross Margin of 64.60% is amongst the best of the industry. ANF outperforms 93.10% of its industry peers.
Assessing Health Metrics for NYSE:ANF
To gauge a stock's financial health, ChartMill utilizes a Health Rating on a scale of 0 to 10. This comprehensive evaluation encompasses liquidity and solvency, both in absolute terms and in comparison to industry peers. NYSE:ANF has earned a 8 out of 10:
- ANF has an Altman-Z score of 5.78. This indicates that ANF is financially healthy and has little risk of bankruptcy at the moment.
- ANF has a Altman-Z score of 5.78. This is amongst the best in the industry. ANF outperforms 87.93% of its industry peers.
- There is no outstanding debt for ANF. This means it has a Debt/Equity and Debt/FCF ratio of 0 and it is amongst the best of the sector and industry.
- ANF's Quick ratio of 0.93 is fine compared to the rest of the industry. ANF outperforms 74.14% of its industry peers.
- The current and quick ratio evaluation for ANF is rather negative, while it does have excellent solvency and profitability. These ratios do not necessarly indicate liquidity issues and need to be evaluated against the specifics of the business.
Assessing Growth Metrics for NYSE:ANF
ChartMill assigns a Growth Rating to every stock. This score ranges from 0 to 10 and evaluates the different growth aspects like EPS and Revenue, both in the past as in the future. NYSE:ANF scores a 7 out of 10:
- ANF shows a strong growth in Earnings Per Share. In the last year, the EPS has been growing by 144.79%, which is quite impressive.
- Measured over the past years, ANF shows a very strong growth in Earnings Per Share. The EPS has been growing by 39.75% on average per year.
- Looking at the last year, ANF shows a quite strong growth in Revenue. The Revenue has grown by 19.59% in the last year.
- The Earnings Per Share is expected to grow by 25.74% on average over the next years. This is a very strong growth
- The Revenue is expected to grow by 8.75% on average over the next years. This is quite good.
- When comparing the Revenue growth rate of the last years to the growth rate of the upcoming years, we see that the growth is accelerating.
More Decent Value stocks can be found in our Decent Value screener.
Check the latest full fundamental report of ANF for a complete fundamental analysis.
Disclaimer
Important Note: The content of this article is not intended as trading advice. It is essential to perform your own analysis and exercise caution when making trading decisions. The article presents observations created by automated analysis but does not guarantee any trading or investment outcomes. Always trade responsibly and make independent judgments.
