
NYSE:ANF is a prime example of a stock that offers more than what meets the eye in terms of fundamentals.
By Mill Chart
Last update: Oct 16, 2024
Discover ABERCROMBIE & FITCH CO-CL A (NYSE:ANF), an undervalued stock highlighted by our stock screener. NYSE:ANF showcases solid financial health and profitability while maintaining an appealing valuation. We'll explore the details.
Assessing Valuation for NYSE:ANF
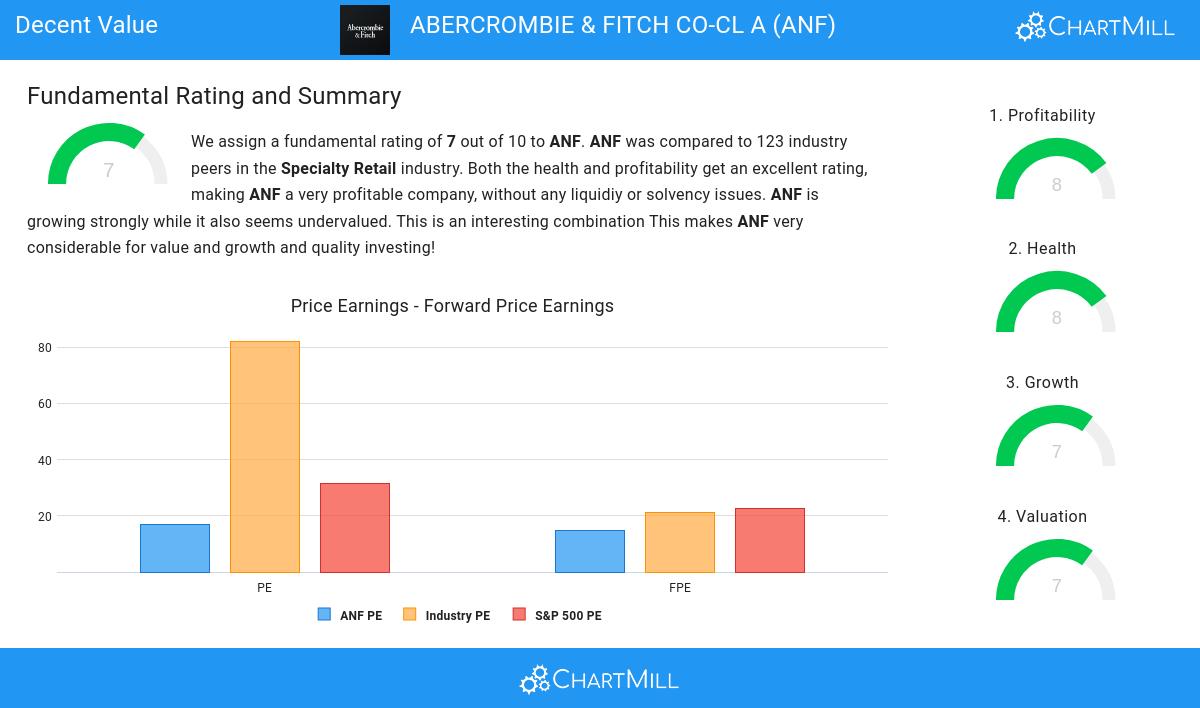
ChartMill assigns a proprietary Valuation Rating to each stock. The score is computed by evaluating various valuation aspects, like price to earnings and free cash flow, both absolutely as relative to the market and industry. NYSE:ANF was assigned a score of 7 for valuation:
- 68.59% of the companies in the same industry are more expensive than ANF, based on the Price/Earnings ratio.
- Compared to an average S&P500 Price/Earnings ratio of 31.61, ANF is valued a bit cheaper.
- Compared to the rest of the industry, the Price/Forward Earnings ratio of ANF indicates a somewhat cheap valuation: ANF is cheaper than 66.12% of the companies listed in the same industry.
- ANF's Price/Forward Earnings ratio indicates a valuation a bit cheaper than the S&P500 average which is at 22.63.
- Based on the Enterprise Value to EBITDA ratio, ANF is valued a bit cheaper than 60.33% of the companies in the same industry.
- Based on the Price/Free Cash Flow ratio, ANF is valued a bit cheaper than 73.55% of the companies in the same industry.
- ANF's low PEG Ratio(NY), which compensates the Price/Earnings for growth, indicates a rather cheap valuation of the company.
- ANF has an outstanding profitability rating, which may justify a higher PE ratio.
- ANF's earnings are expected to grow with 22.59% in the coming years. This may justify a more expensive valuation.
Profitability Examination for NYSE:ANF
ChartMill assigns a proprietary Profitability Rating to each stock. The score is computed by evaluating various profitability ratios and margins and ranges from 0 to 10. NYSE:ANF was assigned a score of 8 for profitability:
- Looking at the Return On Assets, with a value of 16.45%, ANF belongs to the top of the industry, outperforming 94.21% of the companies in the same industry.
- ANF has a better Return On Equity (41.58%) than 90.08% of its industry peers.
- ANF's Return On Invested Capital of 26.56% is amongst the best of the industry. ANF outperforms 94.21% of its industry peers.
- The 3 year average ROIC (12.86%) for ANF is below the current ROIC(26.56%), indicating increased profibility in the last year.
- ANF has a Profit Margin of 10.76%. This is amongst the best in the industry. ANF outperforms 95.04% of its industry peers.
- ANF's Profit Margin has improved in the last couple of years.
- ANF's Operating Margin of 14.40% is amongst the best of the industry. ANF outperforms 93.39% of its industry peers.
- In the last couple of years the Operating Margin of ANF has grown nicely.
- Looking at the Gross Margin, with a value of 64.60%, ANF belongs to the top of the industry, outperforming 94.21% of the companies in the same industry.
How We Gauge Health for NYSE:ANF
To gauge a stock's financial health, ChartMill utilizes a Health Rating on a scale of 0 to 10. This comprehensive evaluation encompasses liquidity and solvency, both in absolute terms and in comparison to industry peers. NYSE:ANF has earned a 8 out of 10:
- An Altman-Z score of 6.43 indicates that ANF is not in any danger for bankruptcy at the moment.
- With an excellent Altman-Z score value of 6.43, ANF belongs to the best of the industry, outperforming 93.39% of the companies in the same industry.
- There is no outstanding debt for ANF. This means it has a Debt/Equity and Debt/FCF ratio of 0 and it is amongst the best of the sector and industry.
- ANF's Quick ratio of 0.93 is fine compared to the rest of the industry. ANF outperforms 74.38% of its industry peers.
- The current and quick ratio evaluation for ANF is rather negative, while it does have excellent solvency and profitability. These ratios do not necessarly indicate liquidity issues and need to be evaluated against the specifics of the business.
Looking at the Growth
ChartMill assigns a Growth Rating to each stock, ranging from 0 to 10. This rating is determined by analyzing different growth elements, including EPS and revenue growth, spanning both historical and future figures. In the case of NYSE:ANF, the assigned 7 reflects its growth potential:
- The Earnings Per Share has grown by an impressive 308.66% over the past year.
- Measured over the past years, ANF shows a very strong growth in Earnings Per Share. The EPS has been growing by 39.75% on average per year.
- The Revenue has grown by 21.11% in the past year. This is a very strong growth!
- ANF is expected to show a strong growth in Earnings Per Share. In the coming years, the EPS will grow by 22.59% yearly.
- When comparing the Revenue growth rate of the last years to the growth rate of the upcoming years, we see that the growth is accelerating.
Our Decent Value screener lists more Decent Value stocks and is updated daily.
Check the latest full fundamental report of ANF for a complete fundamental analysis.
Disclaimer
This is not investing advice! The article highlights some of the observations at the time of writing, but you should always make your own analysis and invest based on your own insights.