
While growth is established for NYSE:ANF, the stock's valuation remains reasonable.
By Mill Chart
Last update: Oct 4, 2024
ABERCROMBIE & FITCH CO-CL A (NYSE:ANF) has caught the eye of our stock screener as an affordable growth stock. NYSE:ANF is displaying robust growth metrics and also excels in terms of profitability, solvency, and liquidity. Additionally, it appears to be reasonably priced. Let's delve into the details.
Unpacking NYSE:ANF's Growth Rating
ChartMill assigns a Growth Rating to each stock, ranging from 0 to 10. This rating is determined by analyzing different growth elements, including EPS and revenue growth, spanning both historical and future figures. In the case of NYSE:ANF, the assigned 7 reflects its growth potential:
- The Earnings Per Share has grown by an impressive 308.66% over the past year.
- Measured over the past years, ANF shows a very strong growth in Earnings Per Share. The EPS has been growing by 39.75% on average per year.
- ANF shows a strong growth in Revenue. In the last year, the Revenue has grown by 21.11%.
- ANF is expected to show a strong growth in Earnings Per Share. In the coming years, the EPS will grow by 22.59% yearly.
- The Revenue growth rate is accelerating: in the next years the growth will be better than in the last years.
How do we evaluate the Valuation for NYSE:ANF?
ChartMill assigns a Valuation Rating to every stock. This score ranges from 0 to 10 and evaluates the different valuation aspects and compares the price to earnings and cash flows, while taking into account profitability and growth. NYSE:ANF scores a 7 out of 10:
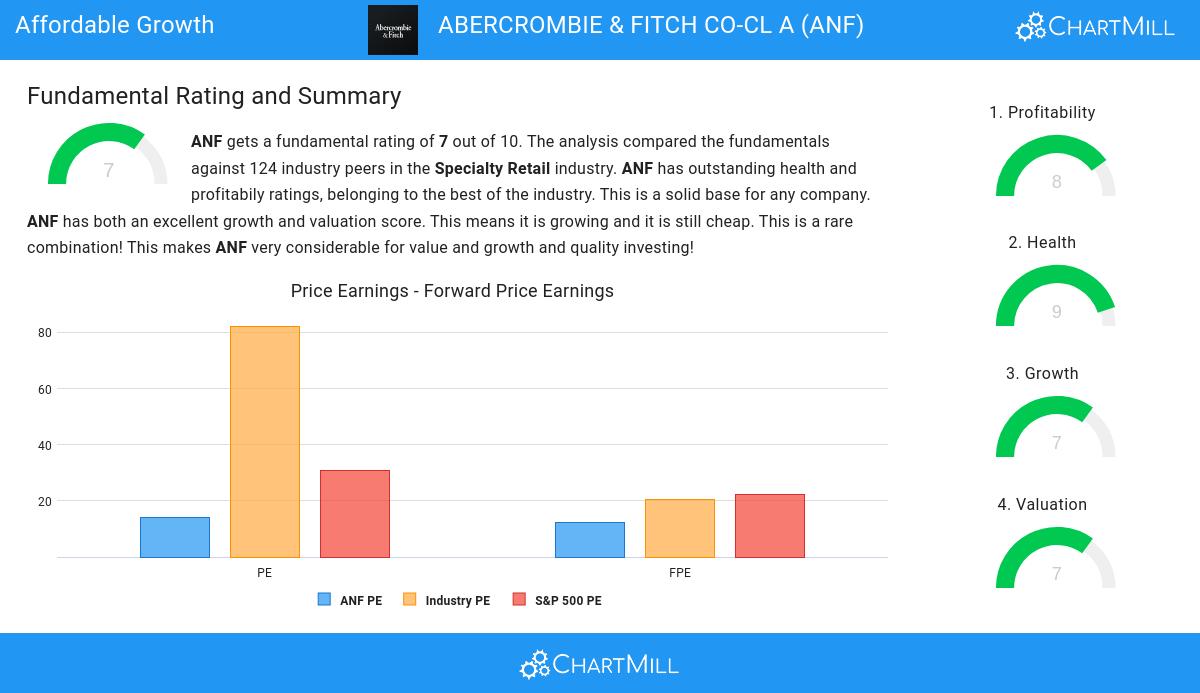
- Based on the Price/Earnings ratio, ANF is valued a bit cheaper than the industry average as 74.59% of the companies are valued more expensively.
- ANF is valuated cheaply when we compare the Price/Earnings ratio to 30.77, which is the current average of the S&P500 Index.
- Based on the Price/Forward Earnings ratio, ANF is valued a bit cheaper than 72.13% of the companies in the same industry.
- The average S&P500 Price/Forward Earnings ratio is at 22.21. ANF is valued slightly cheaper when compared to this.
- Based on the Enterprise Value to EBITDA ratio, ANF is valued a bit cheaper than the industry average as 70.49% of the companies are valued more expensively.
- 77.05% of the companies in the same industry are more expensive than ANF, based on the Price/Free Cash Flow ratio.
- The low PEG Ratio(NY), which compensates the Price/Earnings for growth, indicates a rather cheap valuation of the company.
- ANF has an outstanding profitability rating, which may justify a higher PE ratio.
- A more expensive valuation may be justified as ANF's earnings are expected to grow with 22.59% in the coming years.
How do we evaluate the Health for NYSE:ANF?
ChartMill employs its own Health Rating for stock assessment. This rating, ranging from 0 to 10, is calculated by examining various liquidity and solvency ratios. In the case of NYSE:ANF, the assigned 9 reflects its health status:
- ANF has an Altman-Z score of 5.99. This indicates that ANF is financially healthy and has little risk of bankruptcy at the moment.
- ANF's Altman-Z score of 5.99 is amongst the best of the industry. ANF outperforms 90.98% of its industry peers.
- ANF has no outstanding debt. Therefor its Debt/Equity and Debt/FCF ratios are 0 and belong to the best of the industry.
- With a decent Quick ratio value of 0.93, ANF is doing good in the industry, outperforming 74.59% of the companies in the same industry.
- The current and quick ratio evaluation for ANF is rather negative, while it does have excellent solvency and profitability. These ratios do not necessarly indicate liquidity issues and need to be evaluated against the specifics of the business.
Understanding NYSE:ANF's Profitability
ChartMill assigns a proprietary Profitability Rating to each stock. The score is computed by evaluating various profitability ratios and margins and ranges from 0 to 10. NYSE:ANF was assigned a score of 8 for profitability:
- ANF's Return On Assets of 16.45% is amongst the best of the industry. ANF outperforms 94.26% of its industry peers.
- The Return On Equity of ANF (41.58%) is better than 90.16% of its industry peers.
- ANF has a better Return On Invested Capital (26.56%) than 94.26% of its industry peers.
- The last Return On Invested Capital (26.56%) for ANF is above the 3 year average (12.86%), which is a sign of increasing profitability.
- With an excellent Profit Margin value of 10.76%, ANF belongs to the best of the industry, outperforming 95.08% of the companies in the same industry.
- In the last couple of years the Profit Margin of ANF has grown nicely.
- The Operating Margin of ANF (14.40%) is better than 93.44% of its industry peers.
- ANF's Operating Margin has improved in the last couple of years.
- ANF's Gross Margin of 64.60% is amongst the best of the industry. ANF outperforms 94.26% of its industry peers.
More Affordable Growth stocks can be found in our Affordable Growth screener.
For an up to date full fundamental analysis you can check the fundamental report of ANF
Keep in mind
This is not investing advice! The article highlights some of the observations at the time of writing, but you should always make your own analysis and invest based on your own insights.
NYSE:ANF (4/17/2025, 3:48:09 PM)
72.54
+3.17 (+4.57%)
Find more stocks in the Stock Screener
