
ABERCROMBIE & FITCH CO-CL A (NYSE:ANF) was identified as a decent value stock by our stock screener. NYSE:ANF scores well on profitability, solvency and liquidity. At the same time it seems to be priced very reasonably. We'll explore this a bit deeper below.
Assessing Valuation for NYSE:ANF
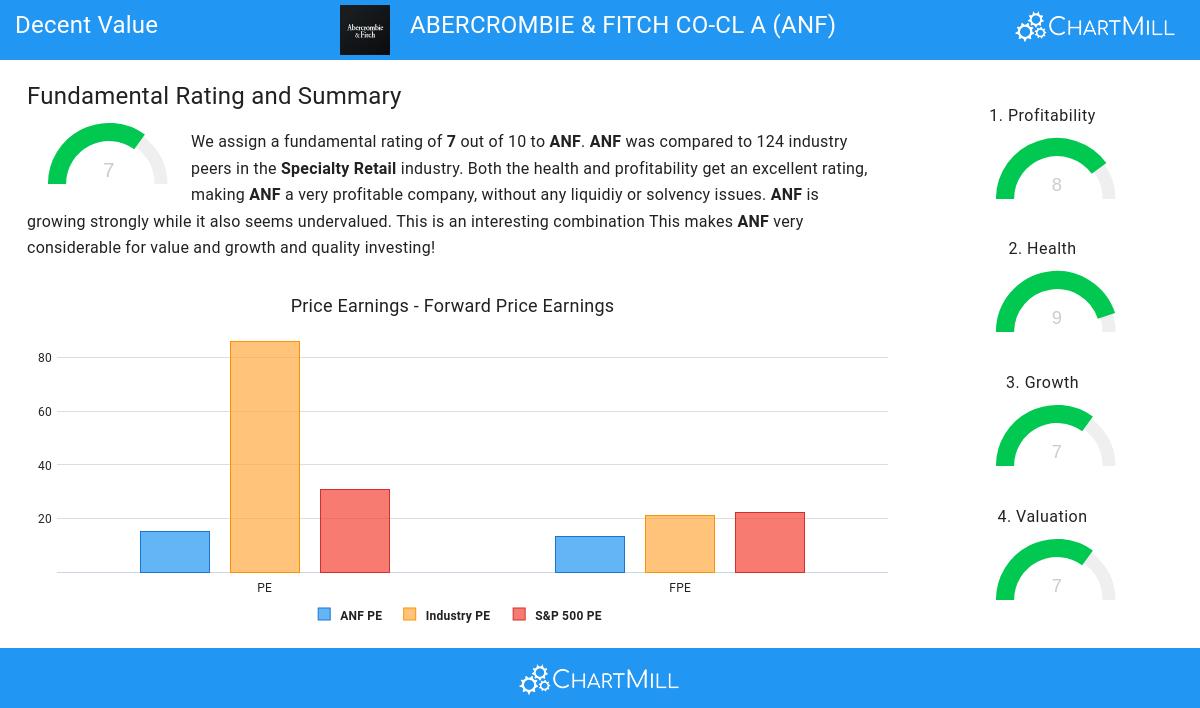
An integral part of ChartMill's stock analysis is the Valuation Rating, which spans from 0 to 10. This rating evaluates diverse valuation factors, including price to earnings and cash flows, while considering the stock's profitability and growth. NYSE:ANF has received a 7 out of 10:
- Based on the Price/Earnings ratio, ANF is valued a bit cheaper than the industry average as 73.77% of the companies are valued more expensively.
- ANF's Price/Earnings ratio indicates a rather cheap valuation when compared to the S&P500 average which is at 30.78.
- ANF's Price/Forward Earnings ratio is a bit cheaper when compared to the industry. ANF is cheaper than 71.31% of the companies in the same industry.
- Compared to an average S&P500 Price/Forward Earnings ratio of 22.30, ANF is valued a bit cheaper.
- ANF's Enterprise Value to EBITDA ratio is a bit cheaper when compared to the industry. ANF is cheaper than 69.67% of the companies in the same industry.
- Based on the Price/Free Cash Flow ratio, ANF is valued a bit cheaper than the industry average as 77.87% of the companies are valued more expensively.
- ANF's low PEG Ratio(NY), which compensates the Price/Earnings for growth, indicates a rather cheap valuation of the company.
- The excellent profitability rating of ANF may justify a higher PE ratio.
- A more expensive valuation may be justified as ANF's earnings are expected to grow with 22.59% in the coming years.
Exploring NYSE:ANF's Profitability
ChartMill assigns a proprietary Profitability Rating to each stock. The score is computed by evaluating various profitability ratios and margins and ranges from 0 to 10. NYSE:ANF was assigned a score of 8 for profitability:
- ANF has a Return On Assets of 16.45%. This is amongst the best in the industry. ANF outperforms 94.26% of its industry peers.
- The Return On Equity of ANF (41.58%) is better than 90.16% of its industry peers.
- The Return On Invested Capital of ANF (26.56%) is better than 94.26% of its industry peers.
- The last Return On Invested Capital (26.56%) for ANF is above the 3 year average (12.86%), which is a sign of increasing profitability.
- The Profit Margin of ANF (10.76%) is better than 95.08% of its industry peers.
- ANF's Profit Margin has improved in the last couple of years.
- ANF's Operating Margin of 14.40% is amongst the best of the industry. ANF outperforms 93.44% of its industry peers.
- In the last couple of years the Operating Margin of ANF has grown nicely.
- The Gross Margin of ANF (64.60%) is better than 94.26% of its industry peers.
Deciphering NYSE:ANF's Health Rating
ChartMill utilizes a Health Rating to assess stocks, scoring them on a scale of 0 to 10. This rating takes into account a variety of liquidity and solvency ratios, both in absolute terms and in comparison to industry peers. NYSE:ANF has earned a 9 out of 10:
- ANF has an Altman-Z score of 6.12. This indicates that ANF is financially healthy and has little risk of bankruptcy at the moment.
- The Altman-Z score of ANF (6.12) is better than 91.80% of its industry peers.
- There is no outstanding debt for ANF. This means it has a Debt/Equity and Debt/FCF ratio of 0 and it is amongst the best of the sector and industry.
- ANF has a better Quick ratio (0.93) than 74.59% of its industry peers.
- ANF does not score too well on the current and quick ratio evaluation. However, as it has excellent solvency and profitability, these ratios do not necessarly indicate liquidity issues and need to be evaluated against the specifics of the business.
Growth Insights: NYSE:ANF
A key component of ChartMill's stock assessment is the Growth Rating, which spans from 0 to 10. This rating evaluates diverse growth factors, such as EPS and revenue growth, considering both past performance and future projections. NYSE:ANF has received a 7 out of 10:
- ANF shows a strong growth in Earnings Per Share. In the last year, the EPS has been growing by 308.66%, which is quite impressive.
- The Earnings Per Share has been growing by 39.75% on average over the past years. This is a very strong growth
- ANF shows a strong growth in Revenue. In the last year, the Revenue has grown by 21.11%.
- Based on estimates for the next years, ANF will show a very strong growth in Earnings Per Share. The EPS will grow by 22.59% on average per year.
- When comparing the Revenue growth rate of the last years to the growth rate of the upcoming years, we see that the growth is accelerating.
More Decent Value stocks can be found in our Decent Value screener.
Check the latest full fundamental report of ANF for a complete fundamental analysis.
Keep in mind
Important Note: The content of this article is not intended as trading advice. It is essential to perform your own analysis and exercise caution when making trading decisions. The article presents observations created by automated analysis but does not guarantee any trading or investment outcomes. Always trade responsibly and make independent judgments.