
Is NASDAQ:AMZN on the Verge of a Major Breakout as a Strong Growth Stock?
By Mill Chart
Last update: Sep 10, 2024
Growth investors are on the lookout for stocks displaying robust revenue and EPS growth. In this analysis, we'll assess whether AMAZON.COM INC (NASDAQ:AMZN) aligns with growth investing criteria, especially as it consolidates and signals a possible breakout. As always, investors should conduct their own research, but AMAZON.COM INC has surfaced on our radar for growth with base formation, warranting further examination.
How do we evaluate the Growth for NASDAQ:AMZN?
ChartMill employs its own Growth Rating system for all stocks. This score, ranging from 0 to 10, is derived by evaluating different growth factors, such as EPS and revenue growth, taking into account both past performance and future projections. NASDAQ:AMZN has earned a 8 for growth:
- AMZN shows a strong growth in Earnings Per Share. In the last year, the EPS has been growing by 202.90%, which is quite impressive.
- Measured over the past years, AMZN shows a very strong growth in Earnings Per Share. The EPS has been growing by 23.57% on average per year.
- The Revenue has grown by 12.32% in the past year. This is quite good.
- AMZN shows quite a strong growth in Revenue. Measured over the last years, the Revenue has been growing by 19.80% yearly.
- AMZN is expected to show a strong growth in Earnings Per Share. In the coming years, the EPS will grow by 29.46% yearly.
- Based on estimates for the next years, AMZN will show a quite strong growth in Revenue. The Revenue will grow by 10.89% on average per year.
- When comparing the EPS growth rate of the last years to the growth rate of the upcoming years, we see that the growth is accelerating.
What does the Health looks like for NASDAQ:AMZN
A critical element of ChartMill's stock evaluation is the Health Rating, which spans from 0 to 10. This rating considers multiple health factors, including liquidity and solvency, both in absolute terms and relative to industry peers. NASDAQ:AMZN has received a 5 out of 10:
- An Altman-Z score of 5.26 indicates that AMZN is not in any danger for bankruptcy at the moment.
- AMZN has a better Altman-Z score (5.26) than 75.76% of its industry peers.
- AMZN has a debt to FCF ratio of 1.66. This is a very positive value and a sign of high solvency as it would only need 1.66 years to pay back of all of its debts.
- AMZN has a Debt to FCF ratio of 1.66. This is in the better half of the industry: AMZN outperforms 66.67% of its industry peers.
- AMZN has a Debt/Equity ratio of 0.30. This is a healthy value indicating a solid balance between debt and equity.
Evaluating Profitability: NASDAQ:AMZN
ChartMill assigns a Profitability Rating to every stock. This score ranges from 0 to 10 and evaluates the different profitability ratios and margins, both absolutely, but also relative to the industry peers. NASDAQ:AMZN scores a 7 out of 10:
- AMZN has a better Return On Assets (8.01%) than 75.76% of its industry peers.
- AMZN's Return On Equity of 18.79% is fine compared to the rest of the industry. AMZN outperforms 69.70% of its industry peers.
- With a decent Return On Invested Capital value of 11.11%, AMZN is doing good in the industry, outperforming 72.73% of the companies in the same industry.
- The 3 year average ROIC (6.30%) for AMZN is below the current ROIC(11.11%), indicating increased profibility in the last year.
- AMZN has a better Profit Margin (7.35%) than 78.79% of its industry peers.
- In the last couple of years the Profit Margin of AMZN has grown nicely.
- AMZN has a Operating Margin of 9.00%. This is in the better half of the industry: AMZN outperforms 75.76% of its industry peers.
- AMZN's Operating Margin has improved in the last couple of years.
- AMZN's Gross Margin of 48.04% is fine compared to the rest of the industry. AMZN outperforms 69.70% of its industry peers.
- AMZN's Gross Margin has improved in the last couple of years.
Why is NASDAQ:AMZN a setup?
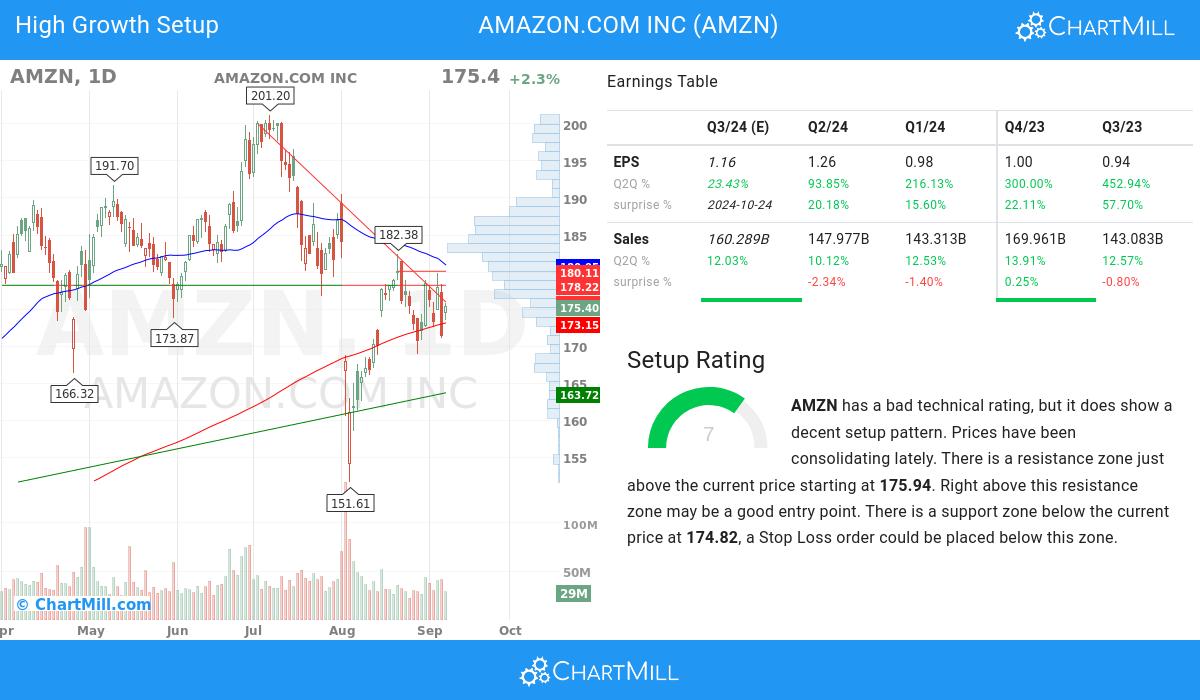
ChartMill incorporates a Setup Rating in its analysis, which measures the extent of consolidation in a stock over recent days and weeks. This rating, ranging from 0 to 10, is updated daily and takes into account multiple short-term technical indicators. The current setup rating for NASDAQ:AMZN is 7:
Although the technical rating is bad, AMZN does present a nice setup opportunity. Prices have been consolidating lately. There is a resistance zone just above the current price starting at 175.94. Right above this resistance zone may be a good entry point. There is a support zone below the current price at 174.82, a Stop Loss order could be placed below this zone.
Every day, new Strong Growth stocks can be found on ChartMill in our Strong Growth screener.
Check the latest full fundamental report of AMZN for a complete fundamental analysis.
Check the latest full technical report of AMZN for a complete technical analysis.
Keep in mind
This article should in no way be interpreted as advice. The article is based on the observed metrics at the time of writing, but you should always make your own analysis and trade or invest at your own responsibility.