
NASDAQ:AMKR is probably undervalued for the fundamentals it is displaying.
By Mill Chart
Last update: Oct 4, 2024
Take a closer look at AMKOR TECHNOLOGY INC (NASDAQ:AMKR), a remarkable value stock uncovered by our stock screener. NASDAQ:AMKR excels in fundamentals and maintains a very reasonable valuation. Let's break it down further.
Valuation Analysis for NASDAQ:AMKR
An integral part of ChartMill's stock analysis is the Valuation Rating, which spans from 0 to 10. This rating evaluates diverse valuation factors, including price to earnings and cash flows, while considering the stock's profitability and growth. NASDAQ:AMKR has received a 7 out of 10:
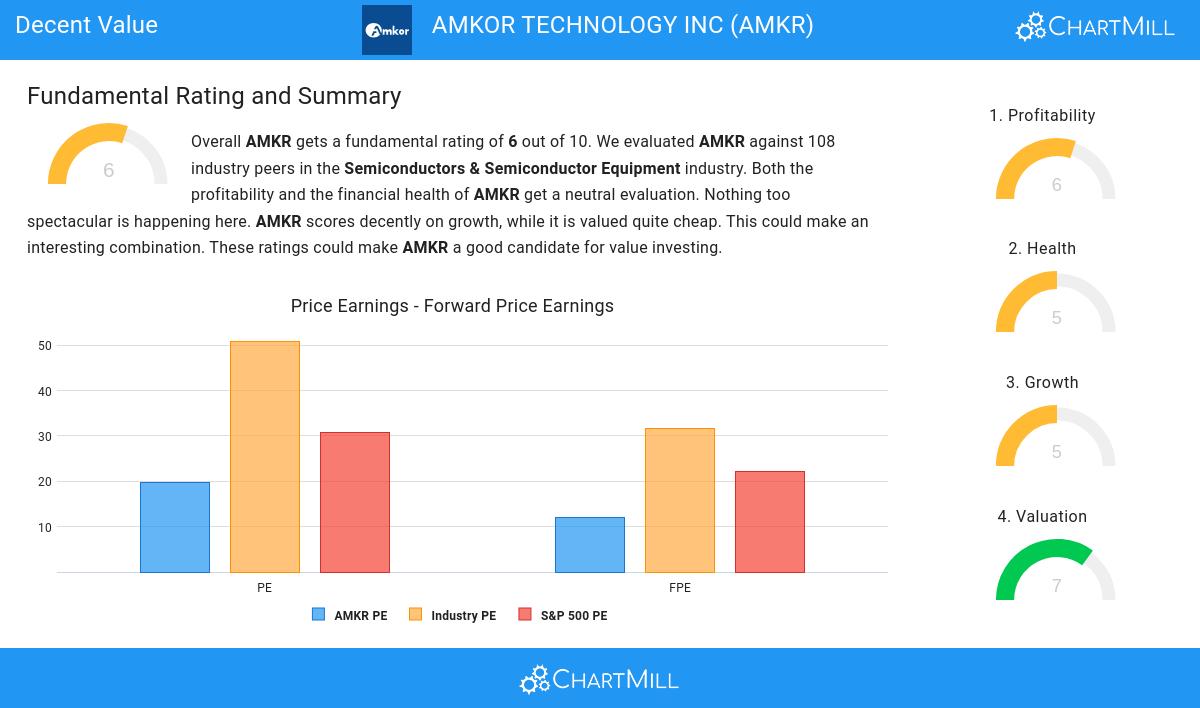
- Based on the Price/Earnings ratio, AMKR is valued cheaply inside the industry as 80.56% of the companies are valued more expensively.
- AMKR is valuated rather cheaply when we compare the Price/Earnings ratio to 30.77, which is the current average of the S&P500 Index.
- A Price/Forward Earnings ratio of 11.99 indicates a reasonable valuation of AMKR.
- Compared to the rest of the industry, the Price/Forward Earnings ratio of AMKR indicates a rather cheap valuation: AMKR is cheaper than 90.74% of the companies listed in the same industry.
- AMKR's Price/Forward Earnings ratio indicates a valuation a bit cheaper than the S&P500 average which is at 22.21.
- Compared to the rest of the industry, the Enterprise Value to EBITDA ratio of AMKR indicates a rather cheap valuation: AMKR is cheaper than 95.37% of the companies listed in the same industry.
- AMKR's Price/Free Cash Flow ratio is rather cheap when compared to the industry. AMKR is cheaper than 90.74% of the companies in the same industry.
- The decent profitability rating of AMKR may justify a higher PE ratio.
- A more expensive valuation may be justified as AMKR's earnings are expected to grow with 28.12% in the coming years.
Profitability Analysis for NASDAQ:AMKR
Discover ChartMill's exclusive Profitability Rating, a proprietary metric that assesses stocks on a scale of 0 to 10. It takes into consideration various profitability ratios and margins, both in absolute terms and relative to industry peers. Notably, NASDAQ:AMKR has achieved a 6:
- Looking at the Return On Assets, with a value of 5.48%, AMKR is in the better half of the industry, outperforming 70.37% of the companies in the same industry.
- With a decent Return On Equity value of 9.28%, AMKR is doing good in the industry, outperforming 66.67% of the companies in the same industry.
- AMKR has a Return On Invested Capital of 7.66%. This is in the better half of the industry: AMKR outperforms 72.22% of its industry peers.
- The last Return On Invested Capital (7.66%) for AMKR is well below the 3 year average (12.46%), which needs to be investigated, but indicates that AMKR had better years and this may not be a problem.
- AMKR's Profit Margin has improved in the last couple of years.
- Looking at the Operating Margin, with a value of 7.50%, AMKR is in the better half of the industry, outperforming 61.11% of the companies in the same industry.
- AMKR's Operating Margin has improved in the last couple of years.
How We Gauge Health for NASDAQ:AMKR
Every stock is evaluated by ChartMill, receiving a Health Rating on a scale of 0 to 10. This assessment considers different health aspects, including liquidity and solvency, both in absolute terms and relative to industry peers. NASDAQ:AMKR has achieved a 5 out of 10:
- An Altman-Z score of 3.43 indicates that AMKR is not in any danger for bankruptcy at the moment.
- The Debt to FCF ratio of AMKR is 2.30, which is a good value as it means it would take AMKR, 2.30 years of fcf income to pay off all of its debts.
- AMKR has a better Debt to FCF ratio (2.30) than 70.37% of its industry peers.
- AMKR has a Debt/Equity ratio of 0.23. This is a healthy value indicating a solid balance between debt and equity.
- A Current Ratio of 2.08 indicates that AMKR has no problem at all paying its short term obligations.
A Closer Look at Growth for NASDAQ:AMKR
Every stock receives a Growth Rating from ChartMill, ranging from 0 to 10. This rating assesses various growth aspects, including historical and projected EPS and revenue growth. NASDAQ:AMKR boasts a 5 out of 10:
- The Earnings Per Share has been growing by 22.01% on average over the past years. This is a very strong growth
- Measured over the past years, AMKR shows a quite strong growth in Revenue. The Revenue has been growing by 8.54% on average per year.
- The Earnings Per Share is expected to grow by 28.12% on average over the next years. This is a very strong growth
- The EPS growth rate is accelerating: in the next years the growth will be better than in the last years.
Every day, new Decent Value stocks can be found on ChartMill in our Decent Value screener.
For an up to date full fundamental analysis you can check the fundamental report of AMKR
Disclaimer
This article should in no way be interpreted as advice. The article is based on the observed metrics at the time of writing, but you should always make your own analysis and trade or invest at your own responsibility.