
Take a closer look at AMETEK INC (NYSE:AME), a stock of interest to dividend investors uncovered by our stock screener. NYSE:AME excels in fundamentals and provides a decent dividend, all while maintaining a reasonable valuation. Let's break it down further.
Looking at the Dividend
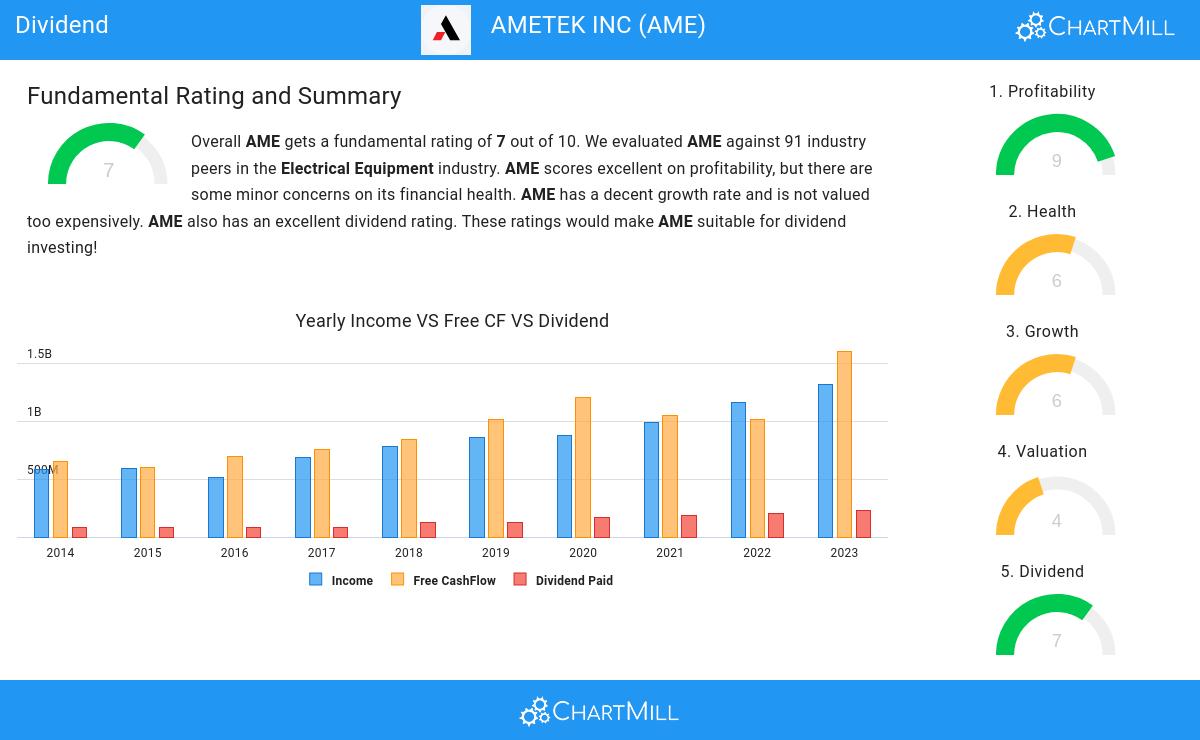
An integral part of ChartMill's stock analysis is the Dividend Rating, which spans from 0 to 10. This rating evaluates diverse dividend factors, including yield, historical data, growth, and sustainability. NYSE:AME has received a 7 out of 10:
- AME's Dividend Yield is rather good when compared to the industry average which is at 2.19. AME pays more dividend than 83.15% of the companies in the same industry.
- The dividend of AME is nicely growing with an annual growth rate of 12.17%!
- AME has been paying a dividend for at least 10 years, so it has a reliable track record.
- AME has not decreased their dividend for at least 10 years, which is a reliable track record.
- 18.37% of the earnings are spent on dividend by AME. This is a low number and sustainable payout ratio.
- The dividend of AME is growing, but earnings are growing more, so the dividend growth is sustainable.
Understanding NYSE:AME's Health Score
ChartMill assigns a Health Rating to every stock. This score ranges from 0 to 10 and evaluates the different health aspects like liquidity and solvency, both absolutely, but also relative to the industry peers. NYSE:AME scores a 6 out of 10:
- AME has an Altman-Z score of 6.19. This indicates that AME is financially healthy and has little risk of bankruptcy at the moment.
- Looking at the Altman-Z score, with a value of 6.19, AME belongs to the top of the industry, outperforming 91.01% of the companies in the same industry.
- AME has a debt to FCF ratio of 1.59. This is a very positive value and a sign of high solvency as it would only need 1.59 years to pay back of all of its debts.
- The Debt to FCF ratio of AME (1.59) is better than 87.64% of its industry peers.
- AME has a Debt/Equity ratio of 0.20. This is a healthy value indicating a solid balance between debt and equity.
- AME does not score too well on the current and quick ratio evaluation. However, as it has excellent solvency and profitability, these ratios do not necessarly indicate liquidity issues and need to be evaluated against the specifics of the business.
What does the Profitability looks like for NYSE:AME
ChartMill's Profitability Rating offers a unique perspective on stock analysis, providing scores from 0 to 10. These ratings consider a wide range of profitability metrics and margins, both in comparison to industry peers and on their own merits. For NYSE:AME, the assigned 9 is a significant indicator of profitability:
- With an excellent Return On Assets value of 9.00%, AME belongs to the best of the industry, outperforming 88.76% of the companies in the same industry.
- AME's Return On Equity of 14.40% is amongst the best of the industry. AME outperforms 87.64% of its industry peers.
- AME has a Return On Invested Capital of 11.49%. This is amongst the best in the industry. AME outperforms 87.64% of its industry peers.
- The 3 year average ROIC (11.01%) for AME is below the current ROIC(11.49%), indicating increased profibility in the last year.
- With an excellent Profit Margin value of 19.52%, AME belongs to the best of the industry, outperforming 98.88% of the companies in the same industry.
- In the last couple of years the Profit Margin of AME has grown nicely.
- AME's Operating Margin of 26.04% is amongst the best of the industry. AME outperforms 98.88% of its industry peers.
- AME's Operating Margin has improved in the last couple of years.
- AME has a Gross Margin of 36.08%. This is amongst the best in the industry. AME outperforms 86.52% of its industry peers.
More Best Dividend stocks can be found in our Best Dividend screener.
Check the latest full fundamental report of AME for a complete fundamental analysis.
Disclaimer
This article should in no way be interpreted as advice. The article is based on the observed metrics at the time of writing, but you should always make your own analysis and trade or invest at your own responsibility.