
AMETEK INC (NYSE:AME) is a hidden gem unveiled by our stock screening tool, featuring a promising dividend outlook alongside solid fundamentals. NYSE:AME demonstrates decent financial health and profitability while ensuring a sustainable dividend. Let's break it down further.
Dividend Assessment of NYSE:AME
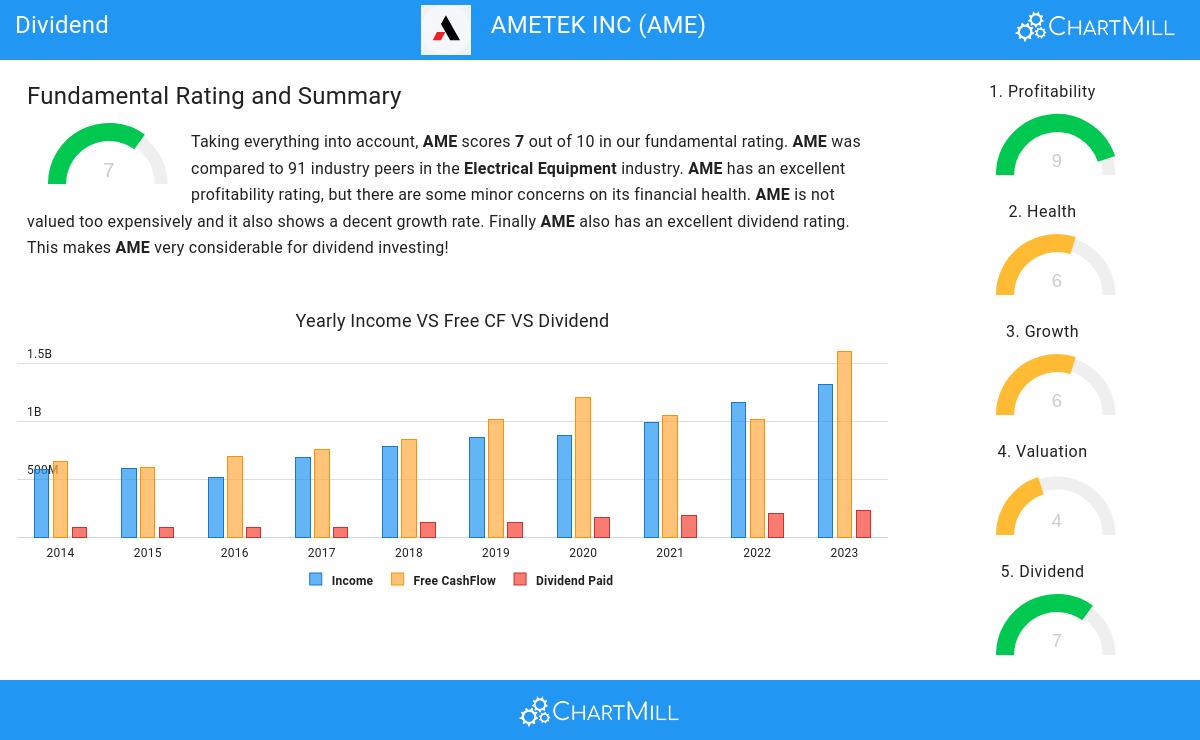
ChartMill assigns a proprietary Dividend Rating to each stock. The score is computed by evaluating various valuation aspects, like the yield, the history, the dividend growth and sustainability. NYSE:AME was assigned a score of 7 for dividend:
- Compared to an average industry Dividend Yield of 2.28, AME pays a better dividend. On top of this AME pays more dividend than 82.02% of the companies listed in the same industry.
- On average, the dividend of AME grows each year by 12.17%, which is quite nice.
- AME has been paying a dividend for at least 10 years, so it has a reliable track record.
- AME has not decreased their dividend for at least 10 years, which is a reliable track record.
- 18.37% of the earnings are spent on dividend by AME. This is a low number and sustainable payout ratio.
- AME's earnings are growing more than its dividend. This makes the dividend growth sustainable.
Assessing Health for NYSE:AME
ChartMill employs a unique Health Rating system for all stocks. This rating, ranging from 0 to 10, is determined by analyzing various liquidity and solvency ratios. For NYSE:AME, the assigned 6 for health provides valuable insights:
- An Altman-Z score of 6.18 indicates that AME is not in any danger for bankruptcy at the moment.
- AME's Altman-Z score of 6.18 is amongst the best of the industry. AME outperforms 91.01% of its industry peers.
- The Debt to FCF ratio of AME is 1.59, which is an excellent value as it means it would take AME, only 1.59 years of fcf income to pay off all of its debts.
- The Debt to FCF ratio of AME (1.59) is better than 87.64% of its industry peers.
- A Debt/Equity ratio of 0.20 indicates that AME is not too dependend on debt financing.
- AME does not score too well on the current and quick ratio evaluation. However, as it has excellent solvency and profitability, these ratios do not necessarly indicate liquidity issues and need to be evaluated against the specifics of the business.
What does the Profitability looks like for NYSE:AME
ChartMill employs its own Profitability Rating system for stock evaluation. This score, ranging from 0 to 10, is derived from an analysis of diverse profitability metrics and margins. In the case of NYSE:AME, the assigned 9 is noteworthy for profitability:
- The Return On Assets of AME (9.00%) is better than 88.76% of its industry peers.
- AME has a better Return On Equity (14.40%) than 87.64% of its industry peers.
- The Return On Invested Capital of AME (11.49%) is better than 87.64% of its industry peers.
- The 3 year average ROIC (11.01%) for AME is below the current ROIC(11.49%), indicating increased profibility in the last year.
- With an excellent Profit Margin value of 19.52%, AME belongs to the best of the industry, outperforming 98.88% of the companies in the same industry.
- AME's Profit Margin has improved in the last couple of years.
- AME has a Operating Margin of 26.04%. This is amongst the best in the industry. AME outperforms 98.88% of its industry peers.
- In the last couple of years the Operating Margin of AME has grown nicely.
- With an excellent Gross Margin value of 36.08%, AME belongs to the best of the industry, outperforming 86.52% of the companies in the same industry.
Our Best Dividend screener lists more Best Dividend stocks and is updated daily.
Check the latest full fundamental report of AME for a complete fundamental analysis.
Keep in mind
This is not investing advice! The article highlights some of the observations at the time of writing, but you should always make your own analysis and invest based on your own insights.