
Despite its impressive fundamentals, NASDAQ:ALKS remains undervalued.
By Mill Chart
Last update: Oct 4, 2024
Uncover the hidden value in ALKERMES PLC (NASDAQ:ALKS) as our stock screening tool recommends it as an undervalued choice. NASDAQ:ALKS maintains a robust financial position and offers an attractive pricing perspective. Let's dig deeper into the analysis.
Looking at the Valuation
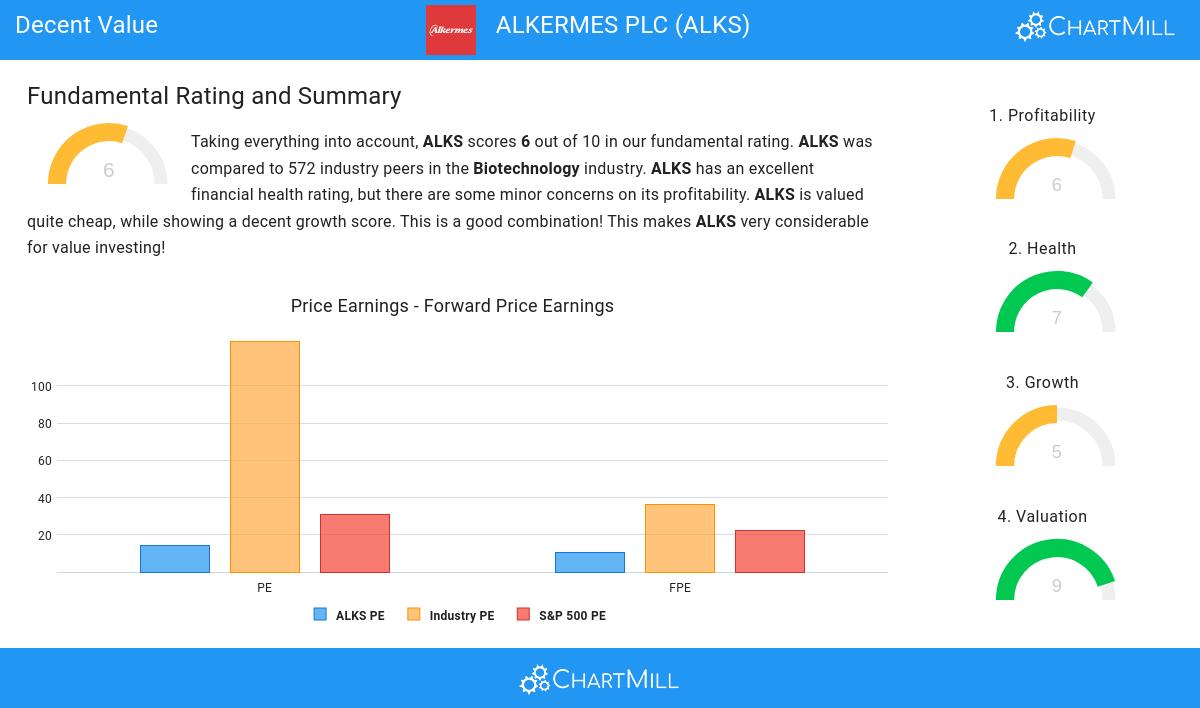
An integral part of ChartMill's stock analysis is the Valuation Rating, which spans from 0 to 10. This rating evaluates diverse valuation factors, including price to earnings and cash flows, while considering the stock's profitability and growth. NASDAQ:ALKS has received a 9 out of 10:
- ALKS's Price/Earnings ratio is rather cheap when compared to the industry. ALKS is cheaper than 97.70% of the companies in the same industry.
- The average S&P500 Price/Earnings ratio is at 30.77. ALKS is valued rather cheaply when compared to this.
- ALKS is valuated reasonably with a Price/Forward Earnings ratio of 10.62.
- Compared to the rest of the industry, the Price/Forward Earnings ratio of ALKS indicates a rather cheap valuation: ALKS is cheaper than 97.88% of the companies listed in the same industry.
- When comparing the Price/Forward Earnings ratio of ALKS to the average of the S&P500 Index (22.21), we can say ALKS is valued rather cheaply.
- Based on the Enterprise Value to EBITDA ratio, ALKS is valued cheaply inside the industry as 98.23% of the companies are valued more expensively.
- 98.23% of the companies in the same industry are more expensive than ALKS, based on the Price/Free Cash Flow ratio.
- ALKS's low PEG Ratio(NY), which compensates the Price/Earnings for growth, indicates a rather cheap valuation of the company.
- The decent profitability rating of ALKS may justify a higher PE ratio.
- A more expensive valuation may be justified as ALKS's earnings are expected to grow with 25.62% in the coming years.
What does the Profitability looks like for NASDAQ:ALKS
ChartMill assigns a proprietary Profitability Rating to each stock. The score is computed by evaluating various profitability ratios and margins and ranges from 0 to 10. NASDAQ:ALKS was assigned a score of 6 for profitability:
- ALKS's Return On Assets of 13.08% is amongst the best of the industry. ALKS outperforms 98.06% of its industry peers.
- ALKS has a better Return On Equity (22.49%) than 97.88% of its industry peers.
- The Return On Invested Capital of ALKS (17.82%) is better than 97.88% of its industry peers.
- With an excellent Profit Margin value of 19.15%, ALKS belongs to the best of the industry, outperforming 97.17% of the companies in the same industry.
- Looking at the Operating Margin, with a value of 25.30%, ALKS belongs to the top of the industry, outperforming 97.35% of the companies in the same industry.
- With an excellent Gross Margin value of 83.31%, ALKS belongs to the best of the industry, outperforming 88.34% of the companies in the same industry.
Unpacking NASDAQ:ALKS's Health Rating
ChartMill assigns a proprietary Health Rating to each stock. The score is computed by evaluating various liquidity and solvency ratios and ranges from 0 to 10. NASDAQ:ALKS was assigned a score of 7 for health:
- ALKS has an Altman-Z score of 4.08. This indicates that ALKS is financially healthy and has little risk of bankruptcy at the moment.
- With a decent Altman-Z score value of 4.08, ALKS is doing good in the industry, outperforming 77.39% of the companies in the same industry.
- The Debt to FCF ratio of ALKS is 0.88, which is an excellent value as it means it would take ALKS, only 0.88 years of fcf income to pay off all of its debts.
- ALKS's Debt to FCF ratio of 0.88 is amongst the best of the industry. ALKS outperforms 96.64% of its industry peers.
- ALKS has a Debt/Equity ratio of 0.22. This is a healthy value indicating a solid balance between debt and equity.
- Although ALKS does not score too well on debt/equity it has very limited outstanding debt, which is well covered by the FCF. We will not put too much weight on the debt/equity number as it may be because of low equity, which could be a consequence of a share buyback program for instance. This needs to be investigated.
- ALKS has a Current Ratio of 2.99. This indicates that ALKS is financially healthy and has no problem in meeting its short term obligations.
- ALKS has a Quick Ratio of 2.61. This indicates that ALKS is financially healthy and has no problem in meeting its short term obligations.
A Closer Look at Growth for NASDAQ:ALKS
ChartMill assigns a Growth Rating to every stock. This score ranges from 0 to 10 and evaluates the different growth aspects like EPS and Revenue, both in the past as in the future. NASDAQ:ALKS scores a 5 out of 10:
- The Earnings Per Share has grown by an impressive 176.39% over the past year.
- The Earnings Per Share has been growing by 18.41% on average over the past years. This is quite good.
- Measured over the past years, ALKS shows a quite strong growth in Revenue. The Revenue has been growing by 8.74% on average per year.
- Based on estimates for the next years, ALKS will show a quite strong growth in Earnings Per Share. The EPS will grow by 10.51% on average per year.
Our Decent Value screener lists more Decent Value stocks and is updated daily.
Our latest full fundamental report of ALKS contains the most current fundamental analsysis.
Disclaimer
Important Note: The content of this article is not intended as trading advice. It is essential to perform your own analysis and exercise caution when making trading decisions. The article presents observations created by automated analysis but does not guarantee any trading or investment outcomes. Always trade responsibly and make independent judgments.