
Should you consider AGNICO EAGLE MINES LTD (NYSE:AEM) for high growth investing?
By Mill Chart
Last update: Apr 3, 2025
Our stock screener has spotted AGNICO EAGLE MINES LTD (NYSE:AEM) as a possible breakout candidate. A technical breakout setup pattern occurs when the stock is consolidating after a nice uptrend. Whether the actual breakout occurs remains to be seen of course, but it may be interesting to keep an eye on NYSE:AEM.
What is the technical picture of AEM telling us.
ChartMill employs a sophisticated system to assign a Technical Rating to every stock in its analysis. This rating, which ranges from 0 to 10, is determined by carefully assessing multiple technical indicators and properties.
We assign a technical rating of 10 out of 10 to AEM. Both in the recent history as in the last year, AEM has proven to be a steady performer, scoring decent points in every aspect analyzed.
- The long and short term trends are both positive. This is looking good!
- Looking at the yearly performance, AEM did better than 96% of all other stocks. We also observe that the gains produced by AEM over the past year are nicely spread over this period.
- AEM is one of the better performing stocks in the Metals & Mining industry, it outperforms 86% of 151 stocks in the same industry.
- AEM is currently trading near its 52 week high. This is a good sign, certainly because the S&P500 Index is not trading near new highs.
- In the last month AEM has a been trading in the 95.75 - 110.36 range, which is quite wide. It is currently trading near the high of this range.
For an up to date full technical analysis you can check the technical report of AEM
Looking at the Setup
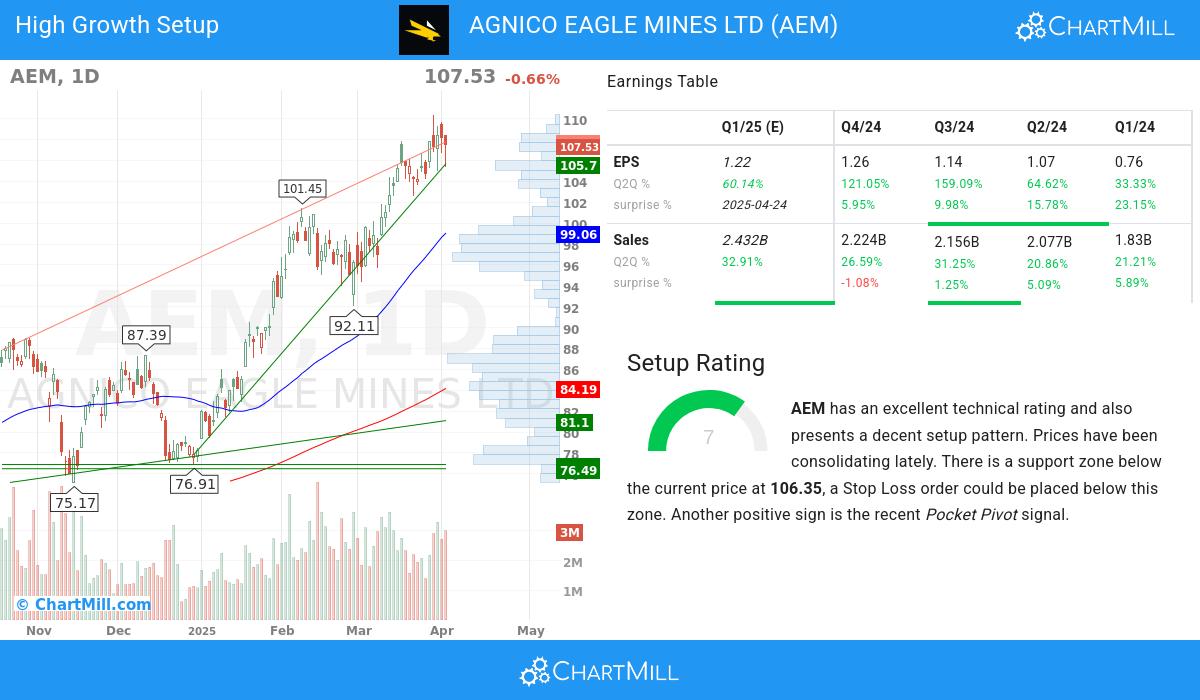
Besides the Technical Rating, ChartMill assigns a Setup Rating to every stock to determine the degree of consolidation. This rating, ranging from 0 to 10, is updated daily and evaluates various short-term technical indicators. AEM currently holds a 7 as its setup rating, suggesting a particular level of consolidation in the stock.
AEM has an excellent technical rating and also presents a decent setup pattern. Prices have been consolidating lately. There is a support zone below the current price at 106.35, a Stop Loss order could be placed below this zone. Very recently a Pocket Pivot signal was observed. This is another positive sign.
What matters for high growth investors.
To evaluate a stock's growth potential, ChartMill utilizes a High Growth Momentum Rating (HGM) on a scale of 0 to 10. This assessment considers various growth and profitability aspects, like EPS and revenue growth, accelleration, surprises and revisions. AEM has achieved a 6 out of 10:
Explosive Earnings Growth
- The quarterly earnings of AEM have shown a 121.0% increase compared to the previous quarter, as revealed in the recent financial report. This growth signifies positive momentum in the company's financials, pointing towards a promising upward trend
- AEM has achieved 89.69% growth in EPS over the past 12 months, reflecting a sustained improvement in earnings performance.
- With consistent quarter-to-quarter (Q2Q) revenue growth of 26.59%, AEM exemplifies its ability to generate increased sales and revenue streams. This growth signifies the company's strong business performance and its potential for continued growth.
- With impressive 1-year revenue growth of 25.03%, AEM showcases its ability to generate increased sales and revenue. This growth highlights the company's strong customer demand and its effective business strategies.
- With a track record of beating EPS estimates in the last 4 quarters, AEM showcases its consistent ability to deliver earnings surprises. This reflects the company's strong execution and its competitive position in the market.
Financial Strength & Profitability
- With a favorable trend in its operating margin over the past year, AEM demonstrates its ability to enhance profitability through efficient operations. This growth reflects the company's focus on optimizing its cost structure.
- The free cash flow (FCF) of AEM has seen steady growth over the past year, indicating enhanced cash flow generation and financial health. This trend underscores the company's effective capital management and its ability to generate sustainable cash flows.
- With a Debt/Equity ratio of 0.06, AEM maintains a solid financial position with controlled leverage.
Market Strength & Institutional Confidence
- AEM exhibits a favorable ownership structure, with an institutional shareholder ownership of 70.84%. This signifies a diverse investor base, which can contribute to a more stable and efficient market for the stock.
- The Relative Strength (RS) of AEM has been consistently solid, with a current 96.68 rating. This highlights the stock's ability to exhibit sustained price strength and signifies its competitive advantage.
More ideas for high growth momentum breakouts can be found on ChartMill in our High Growth Momentum Breakout screen.
Disclaimer
This article should in no way be interpreted as advice. The article is based on the observed metrics at the time of writing, but you should always make your own analysis and trade or invest at your own responsibility.
118.24
-2.86 (-2.36%)
Find more stocks in the Stock Screener
AEM Latest News and Analysis
 15 days ago - ChartmillDoes AGNICO EAGLE MINES LTD (NYSE:AEM) show the characteristics of a Minervini super stock?
A fundamental and technical analysis of (NYSE:AEM): Is AGNICO EAGLE MINES LTD (NYSE:AEM) suited for high growth investing?
