
Exploring high growth characteristics of ADMA BIOLOGICS INC (NASDAQ:ADMA).
By Mill Chart
Last update: Oct 8, 2024
Our stock screener has identified ADMA BIOLOGICS INC (NASDAQ:ADMA) as a potential breakout candidate. This technical breakout setup pattern occurs when the stock consolidates after a strong uptrend. While the actual breakout is uncertain, it may be worth keeping an eye on NASDAQ:ADMA.
Analyzing the Technical Aspects
ChartMill assigns a Technical Rating to every stock. This score ranges from 0 to 10 and is updated daily. The score is determined by evaluating multiple technical indicators and properties.
Taking everything into account, ADMA scores 10 out of 10 in our technical rating. Both in the recent history as in the last year, ADMA has proven to be a steady performer, scoring decent points in every aspect analyzed.
- Both the short term and long term trends are positive. This is a very positive sign.
- Looking at the yearly performance, ADMA did better than 99% of all other stocks. On top of that, ADMA also shows a nice and consistent pattern of rising prices.
- ADMA is one of the better performing stocks in the Biotechnology industry, it outperforms 98% of 573 stocks in the same industry.
- ADMA is currently trading near its 52 week high, which is a good sign. The S&P500 Index however is also trading near new highs, which makes the performance in line with the market.
- In the last month ADMA has a been trading in the 16.91 - 20.58 range, which is quite wide. It is currently trading near the high of this range.
Check the latest full technical report of ADMA for a complete technical analysis.
How do we evaluate the setup for NASDAQ:ADMA?
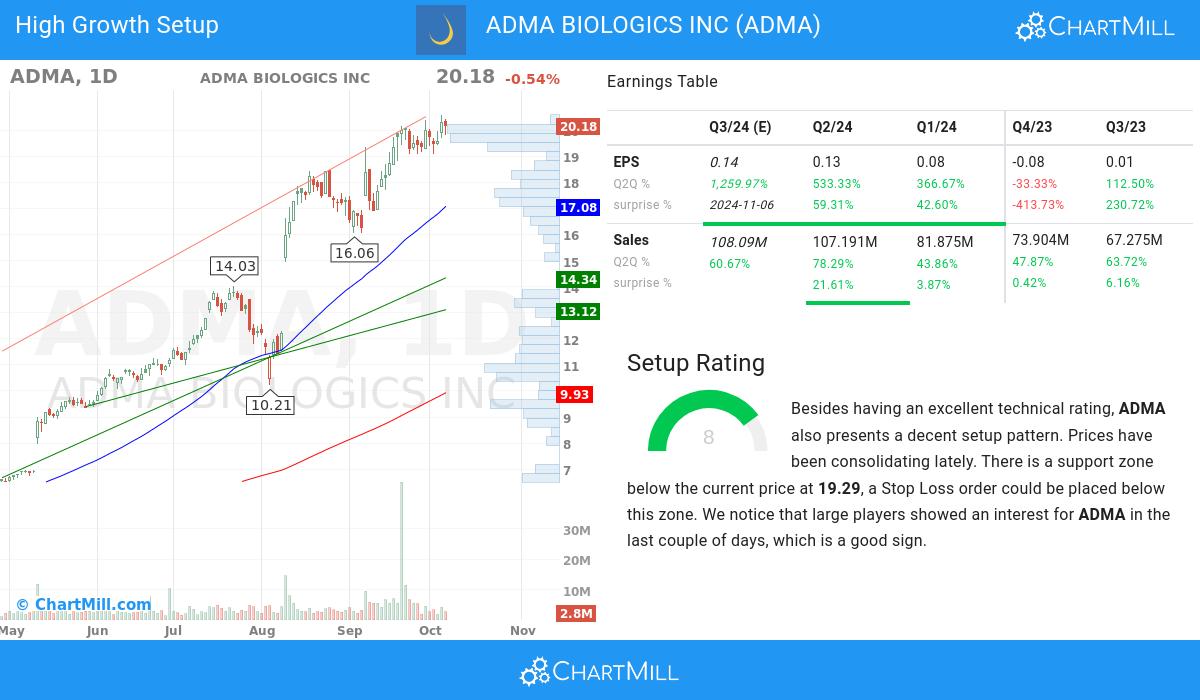
Alongside the Technical Rating, ChartMill assigns a Setup Rating to evaluate the consolidation level of a stock. This rating, ranging from 0 to 10, is updated daily and considers various short-term technical indicators. The current setup rating for NASDAQ:ADMA is 8:
Besides having an excellent technical rating, ADMA also presents a decent setup pattern. Prices have been consolidating lately. There is a support zone below the current price at 19.29, a Stop Loss order could be placed below this zone. We notice that large players showed an interest for ADMA in the last couple of days, which is a good sign.
Looking into the high growth metrics of ADMA BIOLOGICS INC
- With a favorable trend in its quarter-to-quarter (Q2Q) earnings per share (EPS), ADMA BIOLOGICS INC highlights its ability to generate increasing profitability, showcasing a 533.0% growth.
- The quarter-to-quarter (Q2Q) revenue growth of 78.29% of ADMA BIOLOGICS INC has been strong, reflecting the company's ability to generate consistent sales growth. This growth suggests the company's ability to meet customer needs and drive revenue growth.
- The 1-year revenue growth of ADMA BIOLOGICS INC (58.69%) has been strong, reflecting the company's ability to generate consistent sales growth. This growth suggests the company's ability to meet customer needs and expand its market share.
- Analysts' average next Quarter EPS Estimate for ADMA BIOLOGICS INC has witnessed a 44.14% change in the last 3 months, underscoring the dynamic nature of market sentiment towards the company's EPS prospects.
- The recent financial report of ADMA BIOLOGICS INC demonstrates a 533.0% increase in quarterly earnings compared to the previous quarter. This growth indicates positive momentum in the company's financials and suggests a promising upward trend
- accelerating EPS growth for ADMA BIOLOGICS INC: the current Q2Q growth of 533.0% exceeds the previous year Q2Q growth of 57.14%.
- ADMA BIOLOGICS INC has shown positive growth in its operating margin over the past year, indicating improved operational efficiency. This growth highlights the company's ability to effectively manage costs and maximize profitability.
- With positive growth in its free cash flow (FCF) over the past year, ADMA BIOLOGICS INC showcases its ability to generate strong cash flows and maintain a solid financial position. This growth reflects the company's efficient utilization of capital and its commitment to long-term value creation.
- The Return on Equity (ROE) of ADMA BIOLOGICS INC stands at 18.48%, reflecting the company's strong profitability and effective utilization of shareholder equity. This metric signifies the company's ability to generate returns for its investors.
- ADMA BIOLOGICS INC maintains a healthy Debt-to-Equity ratio of 0.7. This indicates the company's conservative capital structure and signifies its ability to effectively manage debt obligations while maintaining a strong equity position.
- The ownership composition of ADMA BIOLOGICS INC reflects a balanced investor ecosystem, with institutional shareholders owning 77.24%. This indicates a broader market participation and potential for increased trading liquidity.
- With a track record of beating EPS estimates 3 times in the last 4 quarters, ADMA BIOLOGICS INC showcases its consistent ability to deliver earnings surprises. This reflects the company's strong execution and its competitive position in the market.
- The Relative Strength (RS) of ADMA BIOLOGICS INC has consistently been strong, with a current 99.72 rating. This indicates the stock's ability to exhibit relative price outperformance and reflects its competitive strength. ADMA BIOLOGICS INC demonstrates promising potential for sustained price momentum.
Our High Growth Momentum Breakout screen will find you more ideas suited for high growth momentum breakouts.
Disclaimer
This article should in no way be interpreted as advice. The article is based on the observed metrics at the time of writing, but you should always make your own analysis and trade or invest at your own responsibility.