
Looking for growth without the hefty price tag? Consider NASDAQ:ADMA.
By Mill Chart
Last update: Sep 24, 2024
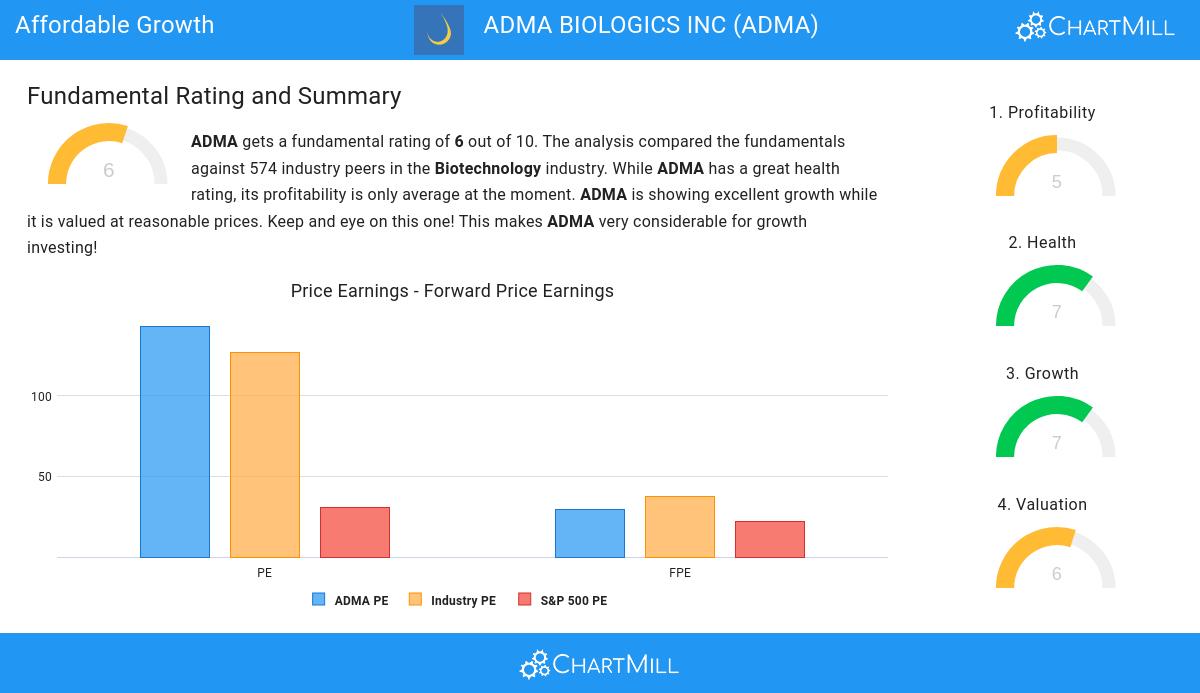
Uncover the potential of ADMA BIOLOGICS INC (NASDAQ:ADMA), a growth stock that our stock screener found to be reasonably priced. NASDAQ:ADMA is excelling in growth aspects, maintaining a healthy financial position, and still offers an attractive valuation. We'll examine each aspect in detail.
Deciphering NASDAQ:ADMA's Growth Rating
ChartMill assigns a proprietary Growth Rating to each stock. The score is computed by evaluating various growth aspects, like EPS and revenue growth. We take into account the history as well as the estimated future numbers. NASDAQ:ADMA was assigned a score of 7 for growth:
- The Earnings Per Share has grown by an impressive 170.00% over the past year.
- The Revenue has grown by 58.69% in the past year. This is a very strong growth!
- ADMA shows a strong growth in Revenue. Measured over the last years, the Revenue has been growing by 72.31% yearly.
- ADMA is expected to show a strong growth in Earnings Per Share. In the coming years, the EPS will grow by 48.00% yearly.
- The Revenue is expected to grow by 16.23% on average over the next years. This is quite good.
A Closer Look at Valuation for NASDAQ:ADMA
ChartMill assigns a Valuation Rating to every stock. This score ranges from 0 to 10 and evaluates the different valuation aspects and compares the price to earnings and cash flows, while taking into account profitability and growth. NASDAQ:ADMA scores a 6 out of 10:
- 93.66% of the companies in the same industry are more expensive than ADMA, based on the Price/Earnings ratio.
- Based on the Price/Forward Earnings ratio, ADMA is valued cheaper than 93.84% of the companies in the same industry.
- Based on the Enterprise Value to EBITDA ratio, ADMA is valued cheaper than 94.19% of the companies in the same industry.
- ADMA's Price/Free Cash Flow ratio is rather cheap when compared to the industry. ADMA is cheaper than 94.19% of the companies in the same industry.
- ADMA's low PEG Ratio(NY), which compensates the Price/Earnings for growth, indicates a rather cheap valuation of the company.
- ADMA's earnings are expected to grow with 97.03% in the coming years. This may justify a more expensive valuation.
A Closer Look at Health for NASDAQ:ADMA
ChartMill assigns a proprietary Health Rating to each stock. The score is computed by evaluating various liquidity and solvency ratios and ranges from 0 to 10. NASDAQ:ADMA was assigned a score of 7 for health:
- ADMA has an Altman-Z score of 15.63. This indicates that ADMA is financially healthy and has little risk of bankruptcy at the moment.
- Looking at the Altman-Z score, with a value of 15.63, ADMA belongs to the top of the industry, outperforming 91.37% of the companies in the same industry.
- The Debt to FCF ratio of ADMA is 1.98, which is an excellent value as it means it would take ADMA, only 1.98 years of fcf income to pay off all of its debts.
- The Debt to FCF ratio of ADMA (1.98) is better than 96.30% of its industry peers.
- Even though the debt/equity ratio score it not favorable for ADMA, it has very limited outstanding debt, so we won't put too much weight on the DE evaluation.
- A Current Ratio of 6.87 indicates that ADMA has no problem at all paying its short term obligations.
- ADMA's Current ratio of 6.87 is fine compared to the rest of the industry. ADMA outperforms 66.73% of its industry peers.
- A Quick Ratio of 2.80 indicates that ADMA has no problem at all paying its short term obligations.
Profitability Analysis for NASDAQ:ADMA
ChartMill's Profitability Rating offers a unique perspective on stock analysis, providing scores from 0 to 10. These ratings consider a wide range of profitability metrics and margins, both in comparison to industry peers and on their own merits. For NASDAQ:ADMA, the assigned 5 is a significant indicator of profitability:
- ADMA has a Return On Assets of 9.24%. This is amongst the best in the industry. ADMA outperforms 96.30% of its industry peers.
- The Return On Equity of ADMA (18.48%) is better than 97.18% of its industry peers.
- The Return On Invested Capital of ADMA (19.96%) is better than 98.59% of its industry peers.
- With an excellent Profit Margin value of 10.54%, ADMA belongs to the best of the industry, outperforming 96.13% of the companies in the same industry.
- ADMA has a Operating Margin of 25.42%. This is amongst the best in the industry. ADMA outperforms 97.54% of its industry peers.
- ADMA's Gross Margin of 46.12% is fine compared to the rest of the industry. ADMA outperforms 78.52% of its industry peers.
Every day, new Affordable Growth stocks can be found on ChartMill in our Affordable Growth screener.
For an up to date full fundamental analysis you can check the fundamental report of ADMA
Keep in mind
This article should in no way be interpreted as advice. The article is based on the observed metrics at the time of writing, but you should always make your own analysis and trade or invest at your own responsibility.