
Mastering the Dragonfly Doji: Spot High-Probability Reversals
The Dragonfly Doji Basics
-
What is it? A single-candle bullish reversal pattern with a long lower shadow and no (or almost no) upper shadow.
-
The Anatomy: Open, High, and Close are virtually identical, forming a "T" shape at the bottom of a downtrend.
-
The Signal: Intraday, the bears pushed prices significantly lower, but the bulls fought back to close the price at the session high.
-
Pro-Filter: Its reliability sky-rockets when it occurs at major support levels (like a 200 SMA or Volume Profile Value Area) on high relative volume.
-
Next Step: Always wait for a confirmation candle closing above the Doji's high before entering. You can scan for these setups instantly using the [ChartMill Dragonfly Doji Screener].
"Most traders spend their lives looking for the 'perfect' bottom, often catching 'falling knives' in the process. Over the years, I’ve realized that the market always leaves a signature when it’s done selling, and few are as definitive as the Dragonfly Doji.
It is a visual representation of a failed coup by the bears.
At the very moment they thought they had broken the market’s floor, the buyers stepped in with enough conviction to erase an entire session’s worth of losses. In this guide, we're analyzing a massive, real-time shift in supply and demand that often marks the exact birth of a new bullish trend.
Let's break down why this specific 'T' is the ultimate signal for high-probability reversals."
The 5 Golden Rules for a High-Probability Dragonfly Doji
To separate a true market reversal from mere noise, I apply these five professional filters. If a candle doesn't meet these criteria, it is rarely worth the risk:
1. The Context of Exhaustion (The "Stretch")
A Dragonfly Doji is only meaningful after a sustained downtrend. I ignore this pattern in sideways or choppy markets. It must appear when the "market rubber band" is stretched to its limit, signaling that sellers have finally run out of steam.
2. The 3:1 Shadow-to-Body Ratio
The lower shadow is your evidence of price rejection. For a high-conviction signal, the shadow should be at least three times the length of the candle’s real body. A short shadow doesn't demonstrate enough of a "fight back" from the bulls to guarantee a trend change.
3. Absolute Absence of an Upper Shadow
A "Masterclass" Dragonfly has no upper shadow. Even a tiny wick at the top suggests that buyers lost a bit of momentum before the close. I want to see the price close at the absolute high of the day, proving the bulls are in total control.
4. Confluence with "Smart Money" Levels
The most powerful Dragonfly Dojis don't happen in a vacuum. They occur when the long shadow "pierces" a major support level - like a 200-day moving average, a psychological round number, or a High Volume Node - only to snap back instantly.
5. The Non-Negotiable Confirmation
I never enter a trade based on the Doji alone. The following candle must close above the high of the Dragonfly. This is your insurance policy; it proves the bulls didn't just show up for one day, but are actually ready to drive the new trend.
Psychology Behind the Dragonfly Doji: The Anatomy of a Failed Breakdown
While many textbooks describe the Dragonfly Doji as a sign of 'market indecision,' I prefer to see it as something much more aggressive: a failed coup by the bears.
The long lower shadow is the visual evidence of a battle. Early in the session, the sellers had complete control, driving prices down in what looked like a definitive breakdown. However, the fact that the price closed back at the high of the day tells us that the bears hit a 'wall' of institutional buying.
Think of it as a spring being compressed to its limit; the harder the bears pushed, the more energy was stored for the eventual bounce. When you see this pattern at the bottom of a trend, you are witnessing the exact moment the market rejected lower prices and the bulls reclaimed the floor."
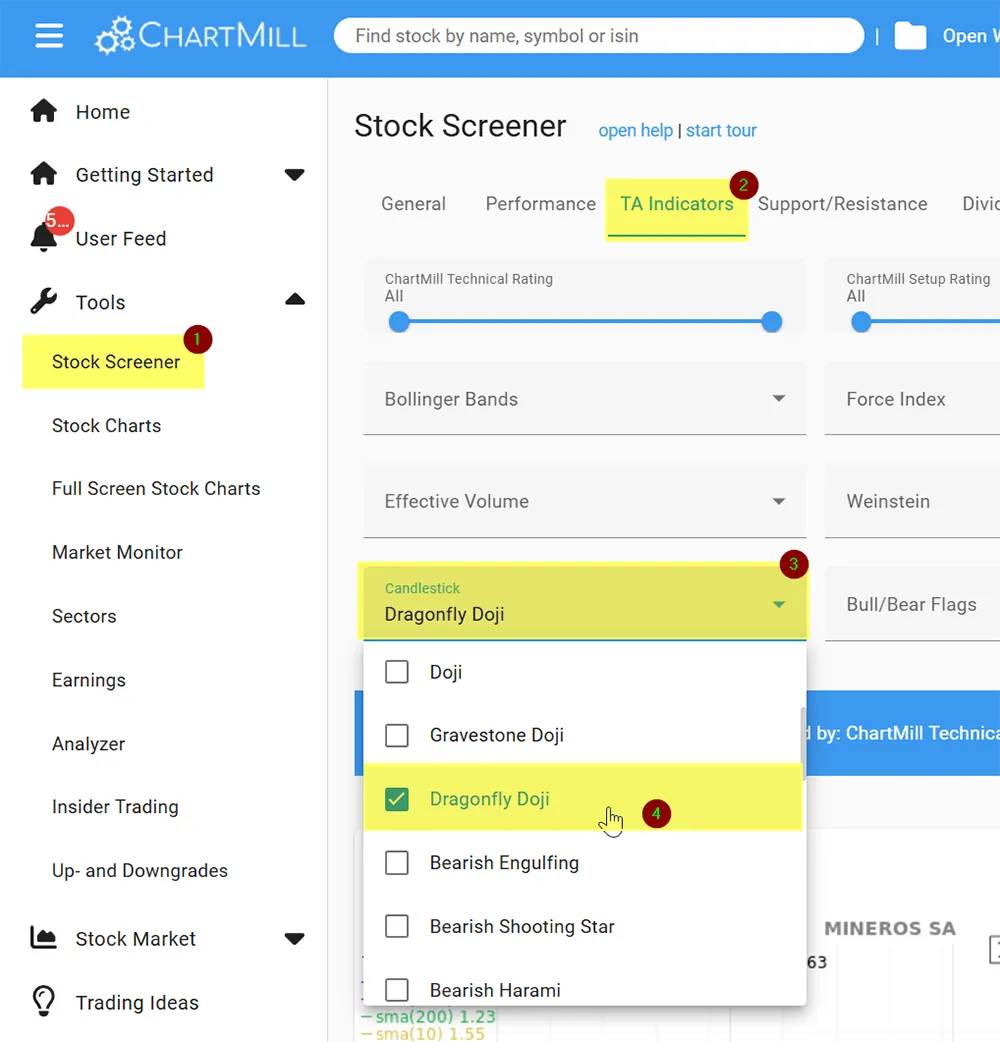
Automating the Hunt: Finding the Dragonfly Doji Pattern with ChartMill
Manually scanning thousands of charts for a single dragonfly doji candlestick is not just time-consuming, it’s inefficient. Professional trading is about filtering the noise to find the highest-probability setups.
At ChartMill, we have built a sophisticated recognition engine that identifies the dragonfly doji pattern across all major exchanges in real-time. But the pattern alone isn't enough; we need to see it in the right context.
 - - -
- - -
This is a direct link to a pre-configured screen that uses the ChartMill Candlestick recognition tool:
I recommend using a "quality-first" filter to ensure the signals you find have institutional backing. You can access my pre-configured Dragonfly Doji Screen here, which uses the following logic:
-
Universe: US stocks with a price above $3 (to avoid the high volatility and low liquidity of penny stocks).
-
Liquidity: Market Cap of at least $300M and Average Daily Volume of 100,000+ shares. This ensures that the "rejection" seen in the Dragonfly is driven by actual capital, not just a few small trades.
-
Trend Context: We look for a Negative/Neutral Short-Term Trend within a Positive/Neutral Long-Term Trend. This specifically targets the "pullback" scenarios where the Dragonfly is most effective.
This screen focuses on the first two candles of the entire pattern. A bearish first candle, followed by a second dragonfly doji candle whose high is lower than or at most equal to the low of the first candle.
From there, you wait to see what the third candle does; if it turns out to be a bullish candle, you are dealing with a full dragonfly doji candlestick pattern and you can consider taking a position as soon as, on day four, the high of the third candle is surpassed (and taking into account the other points of attention in this article).
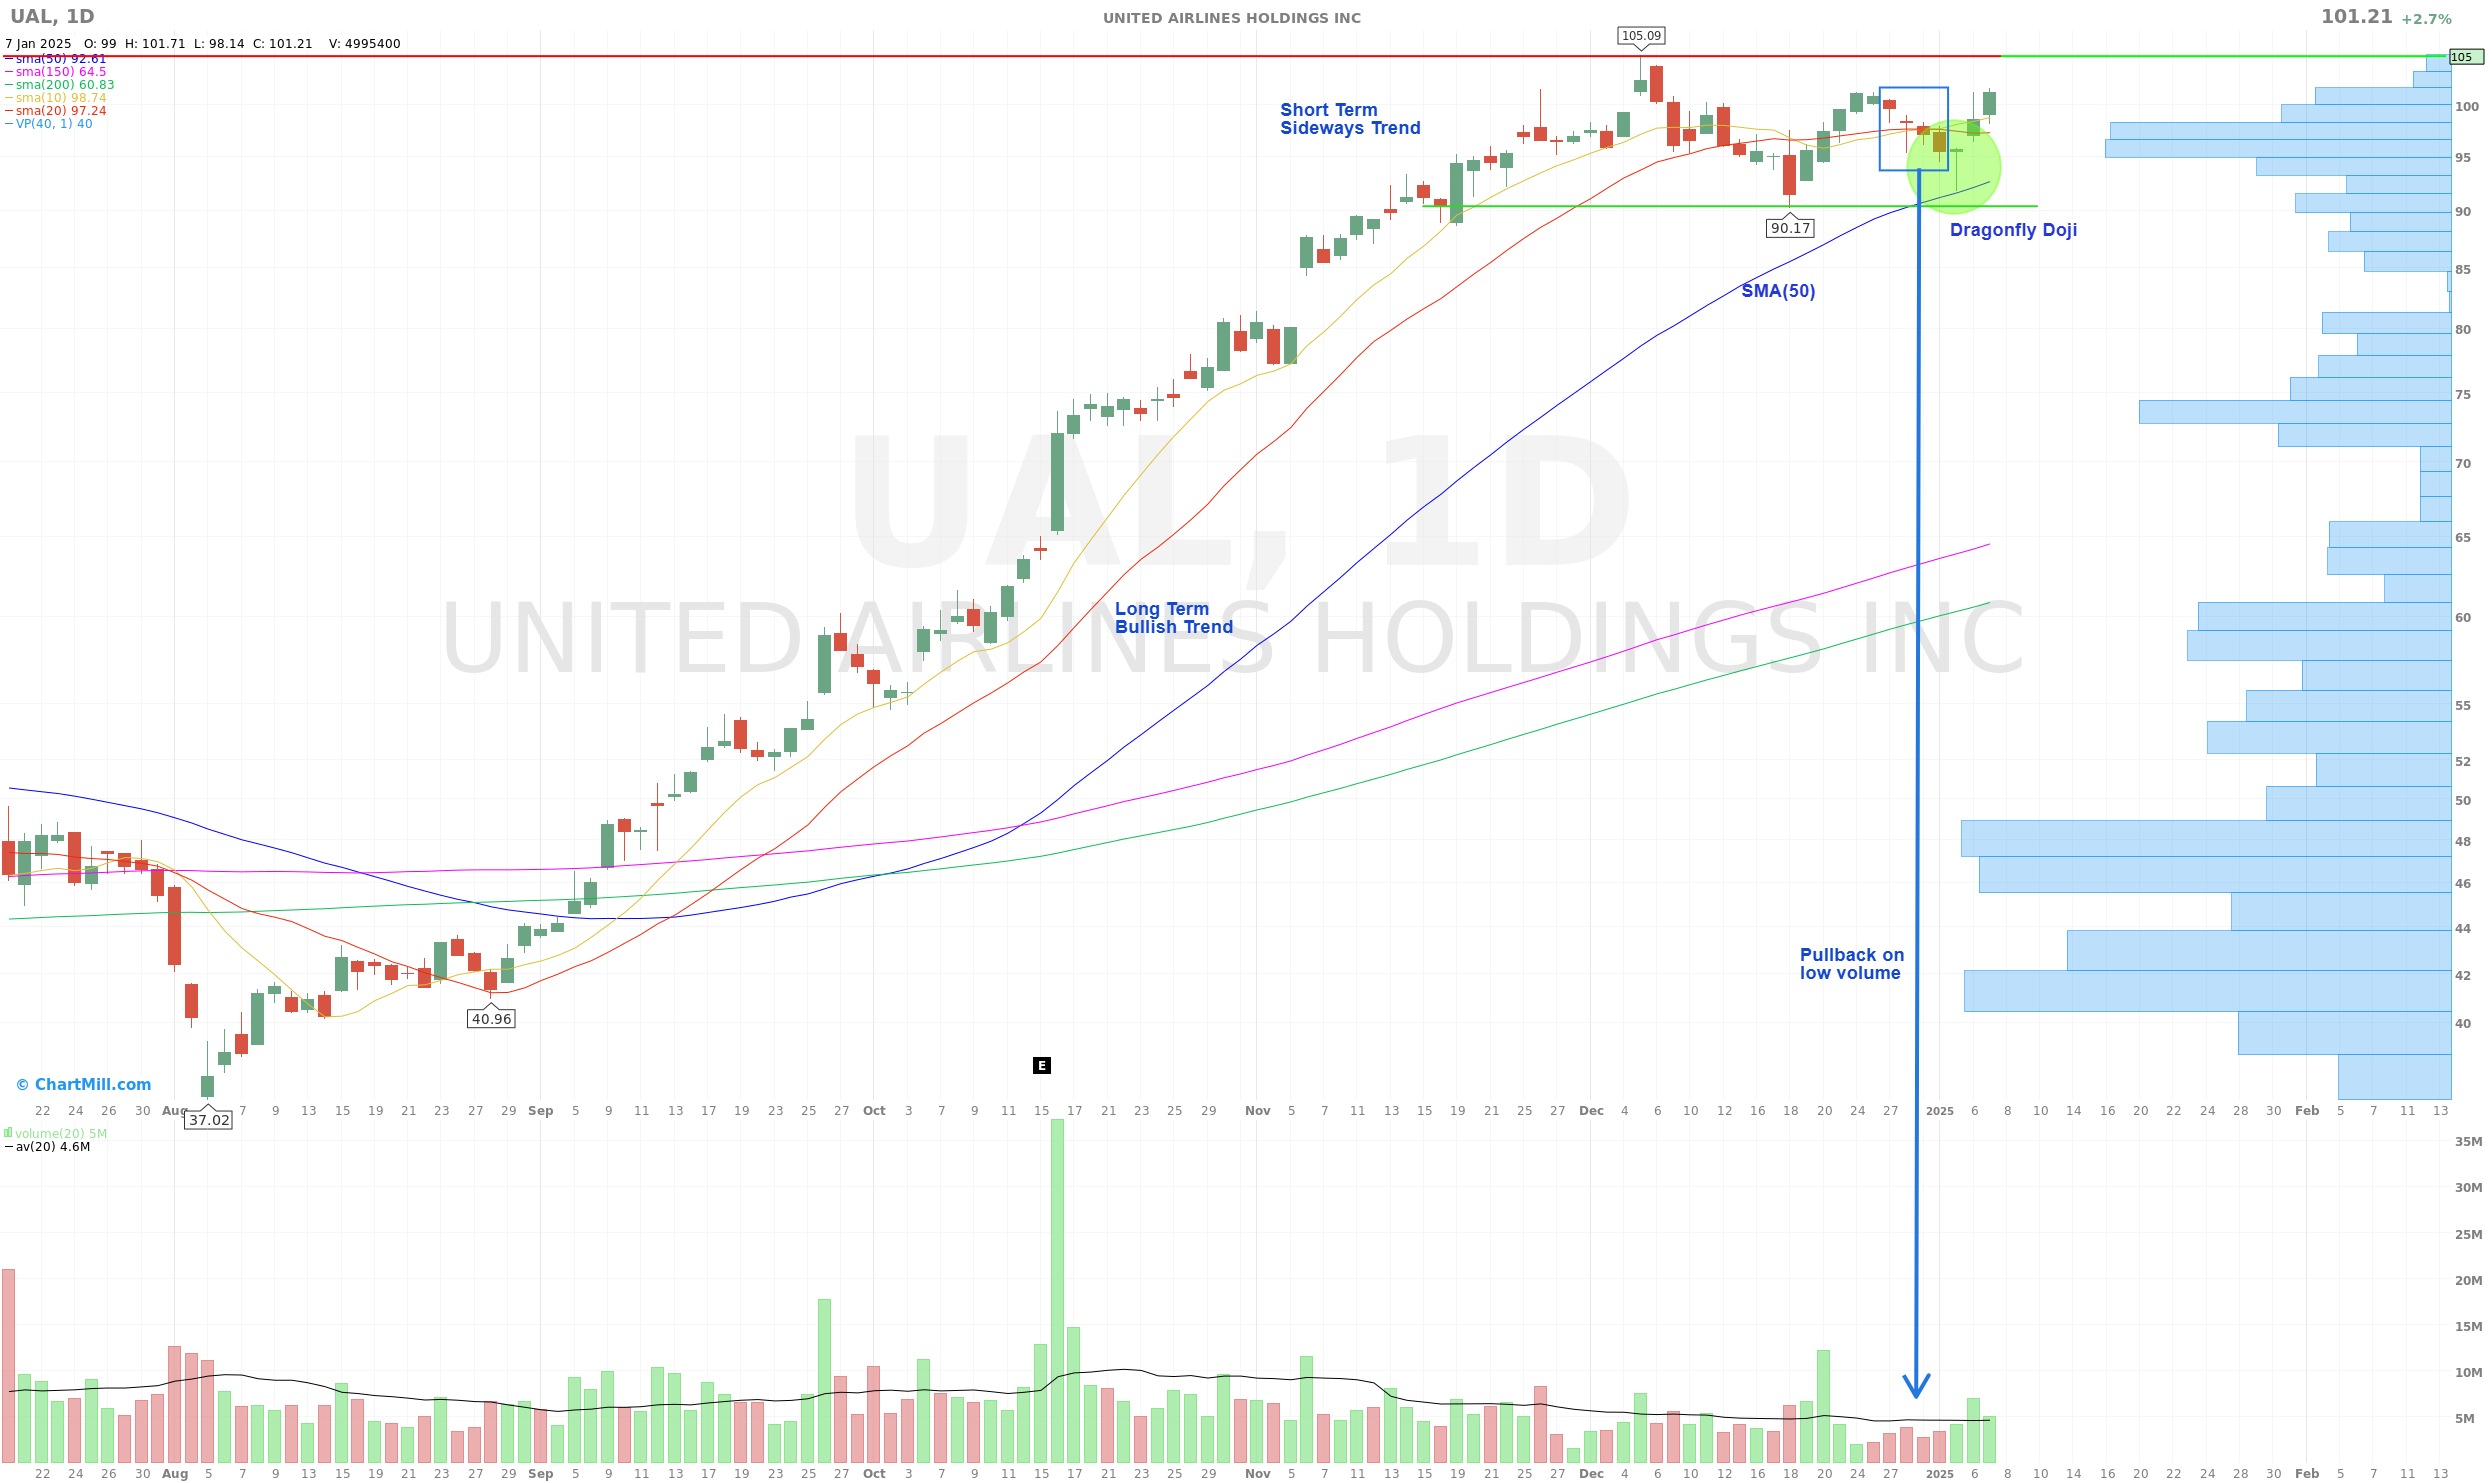
Example 1:
In the chart below for United Airlines (UAL), we see a textbook dragonfly doji pattern forming during a sideways consolidation.
Notice how the long lower shadow "probed" the area just below the 50-day Simple Moving Average (SMA). The bulls immediately rejected this level, closing the price back at the high of the day.
Crucially, the volume during the preceding pullback was lower than the volume during the rise, a classic sign of "quiet distribution" before the Dragonfly signaled the start of a strong recovery move.
Example 2:
This second example demonstrates the importance of moving average confluence. We see two dragonfly doji signals forming at different stages of a correction.
The first occurred as a shallow pullback to the 20-day SMA.
The second, more powerful signal, appeared after a deeper decline. While the price briefly dipped below the 50-day SMA, it held firmly above the 150-day SMA. The resulting Dragonfly Doji confirmed that the long-term buyers were defending their territory, leading to a significant trend reversal.
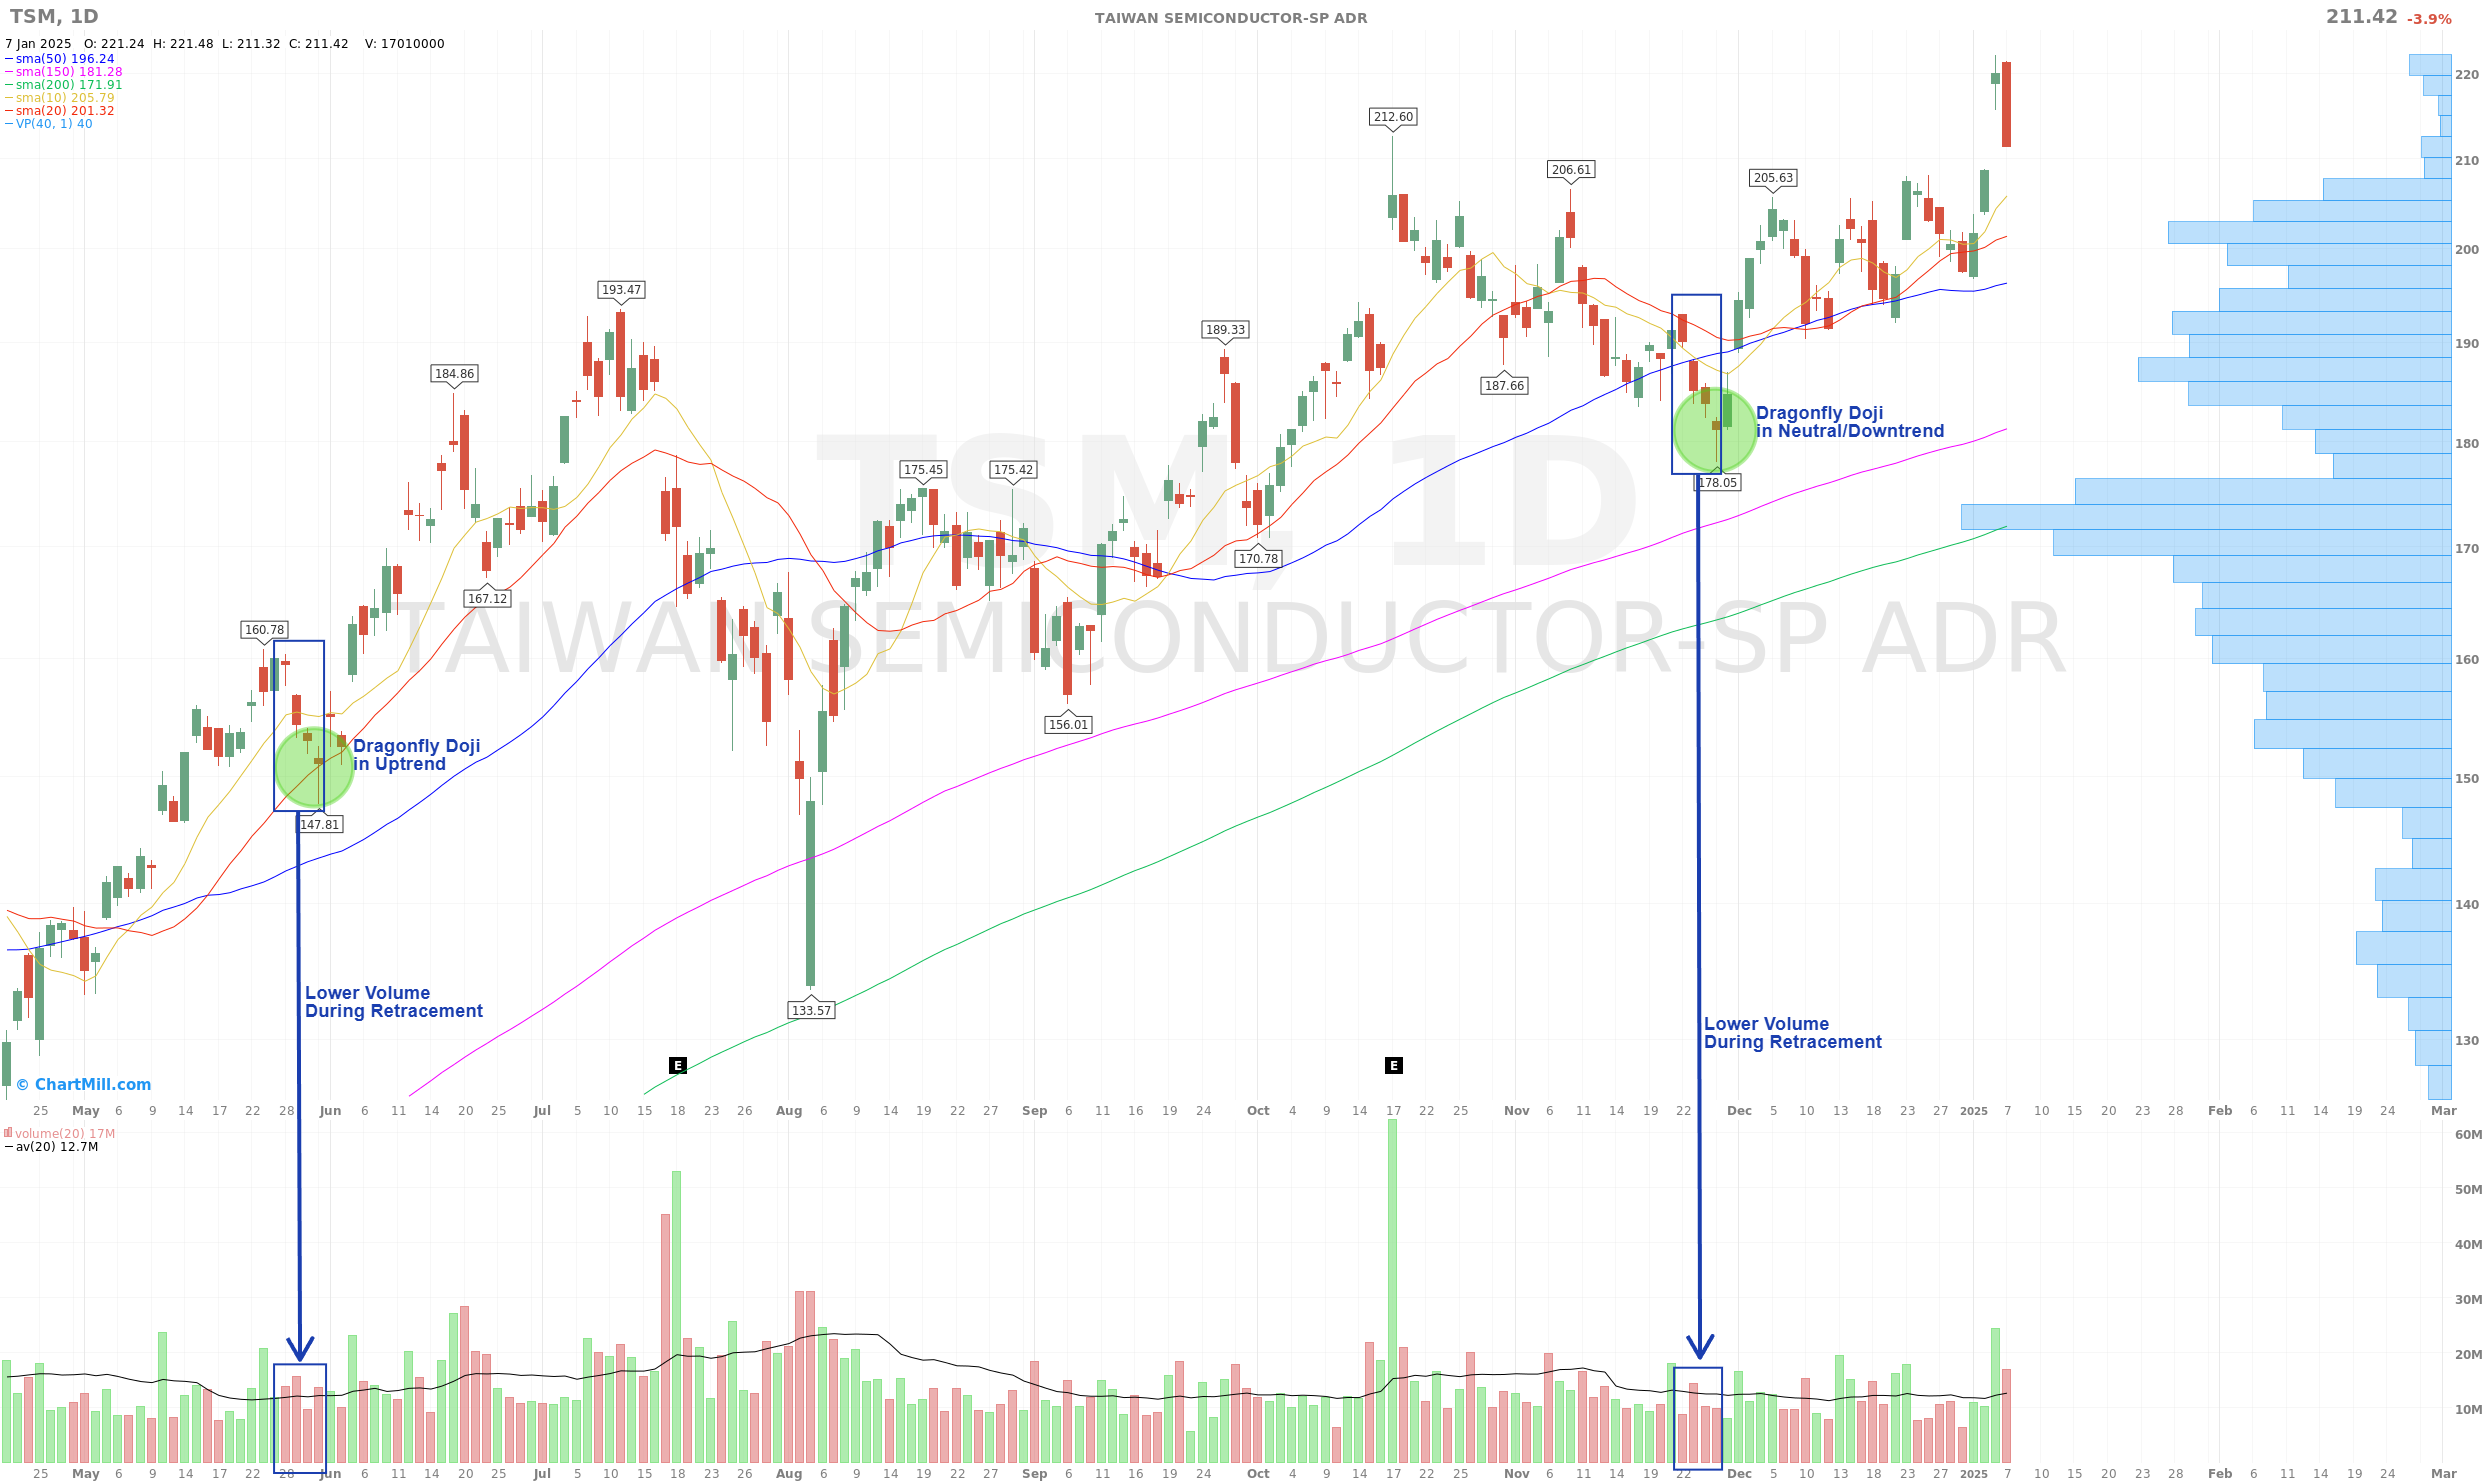
In both instances, the volume profile confirmed the move: the price dropped on thin volume but reversed on high conviction, proving the reliability of the setup.
Strategic Execution: How to Trade the Dragonfly Doji
A dragonfly doji pattern is a powerful signal, but it is not a "buy" button. Trading it successfully requires a disciplined entry strategy and the patience to wait for the market to prove itself.
The Power of Confirmation
In professional trading, a single candle is just a data point. I never treat a standalone dragonfly doji candlestick as a reason to enter. You must wait for confirmation to ensure the bulls have truly seized control.
The Aggressive Entry:
I wait for the price to break above the high of the Dragonfly Doji. This confirms that the intraday momentum has shifted from rejection to an actual rally.
The Conservative Entry:
For higher-conviction setups, I wait for the next candle to close bullish. While this may mean missing the first 1-2% of the move, it significantly reduces the risk of a "fakeout" where the price pauses but then continues its downward slide.
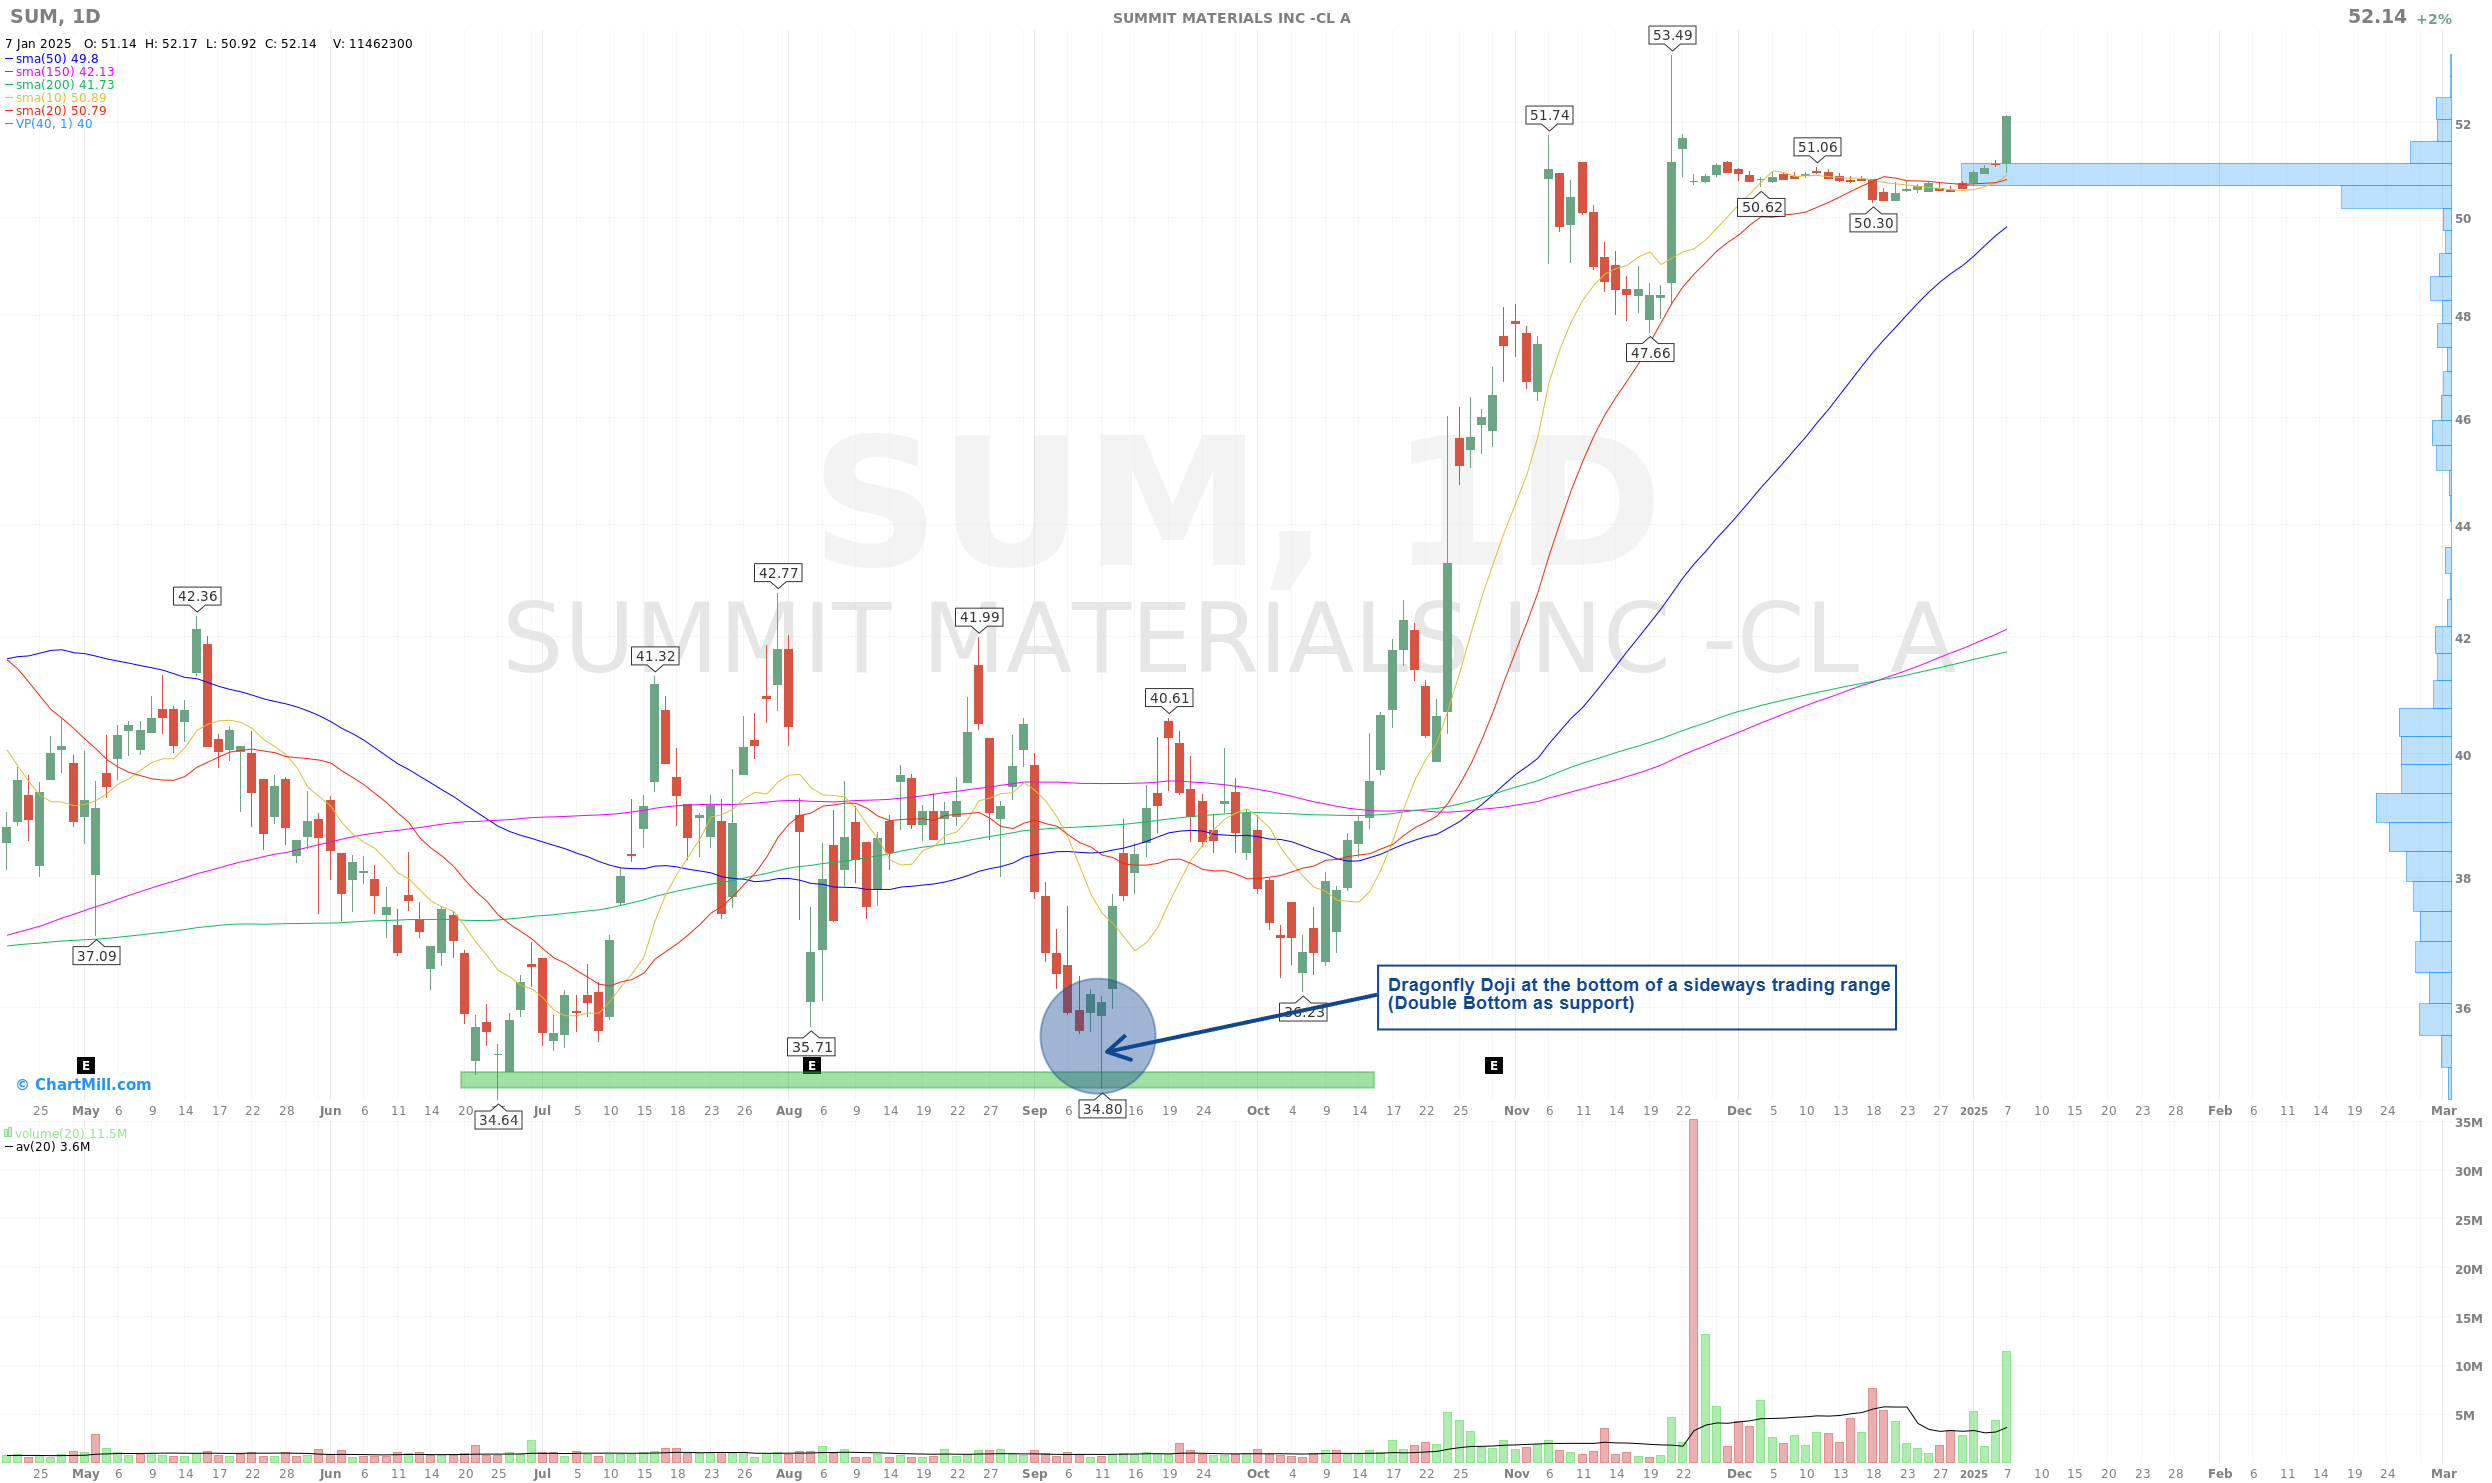
The Law of Confluence: Support and Resistance
A dragonfly doji pattern gains massive reliability when it occurs at a pre-existing "battleground" on the chart.
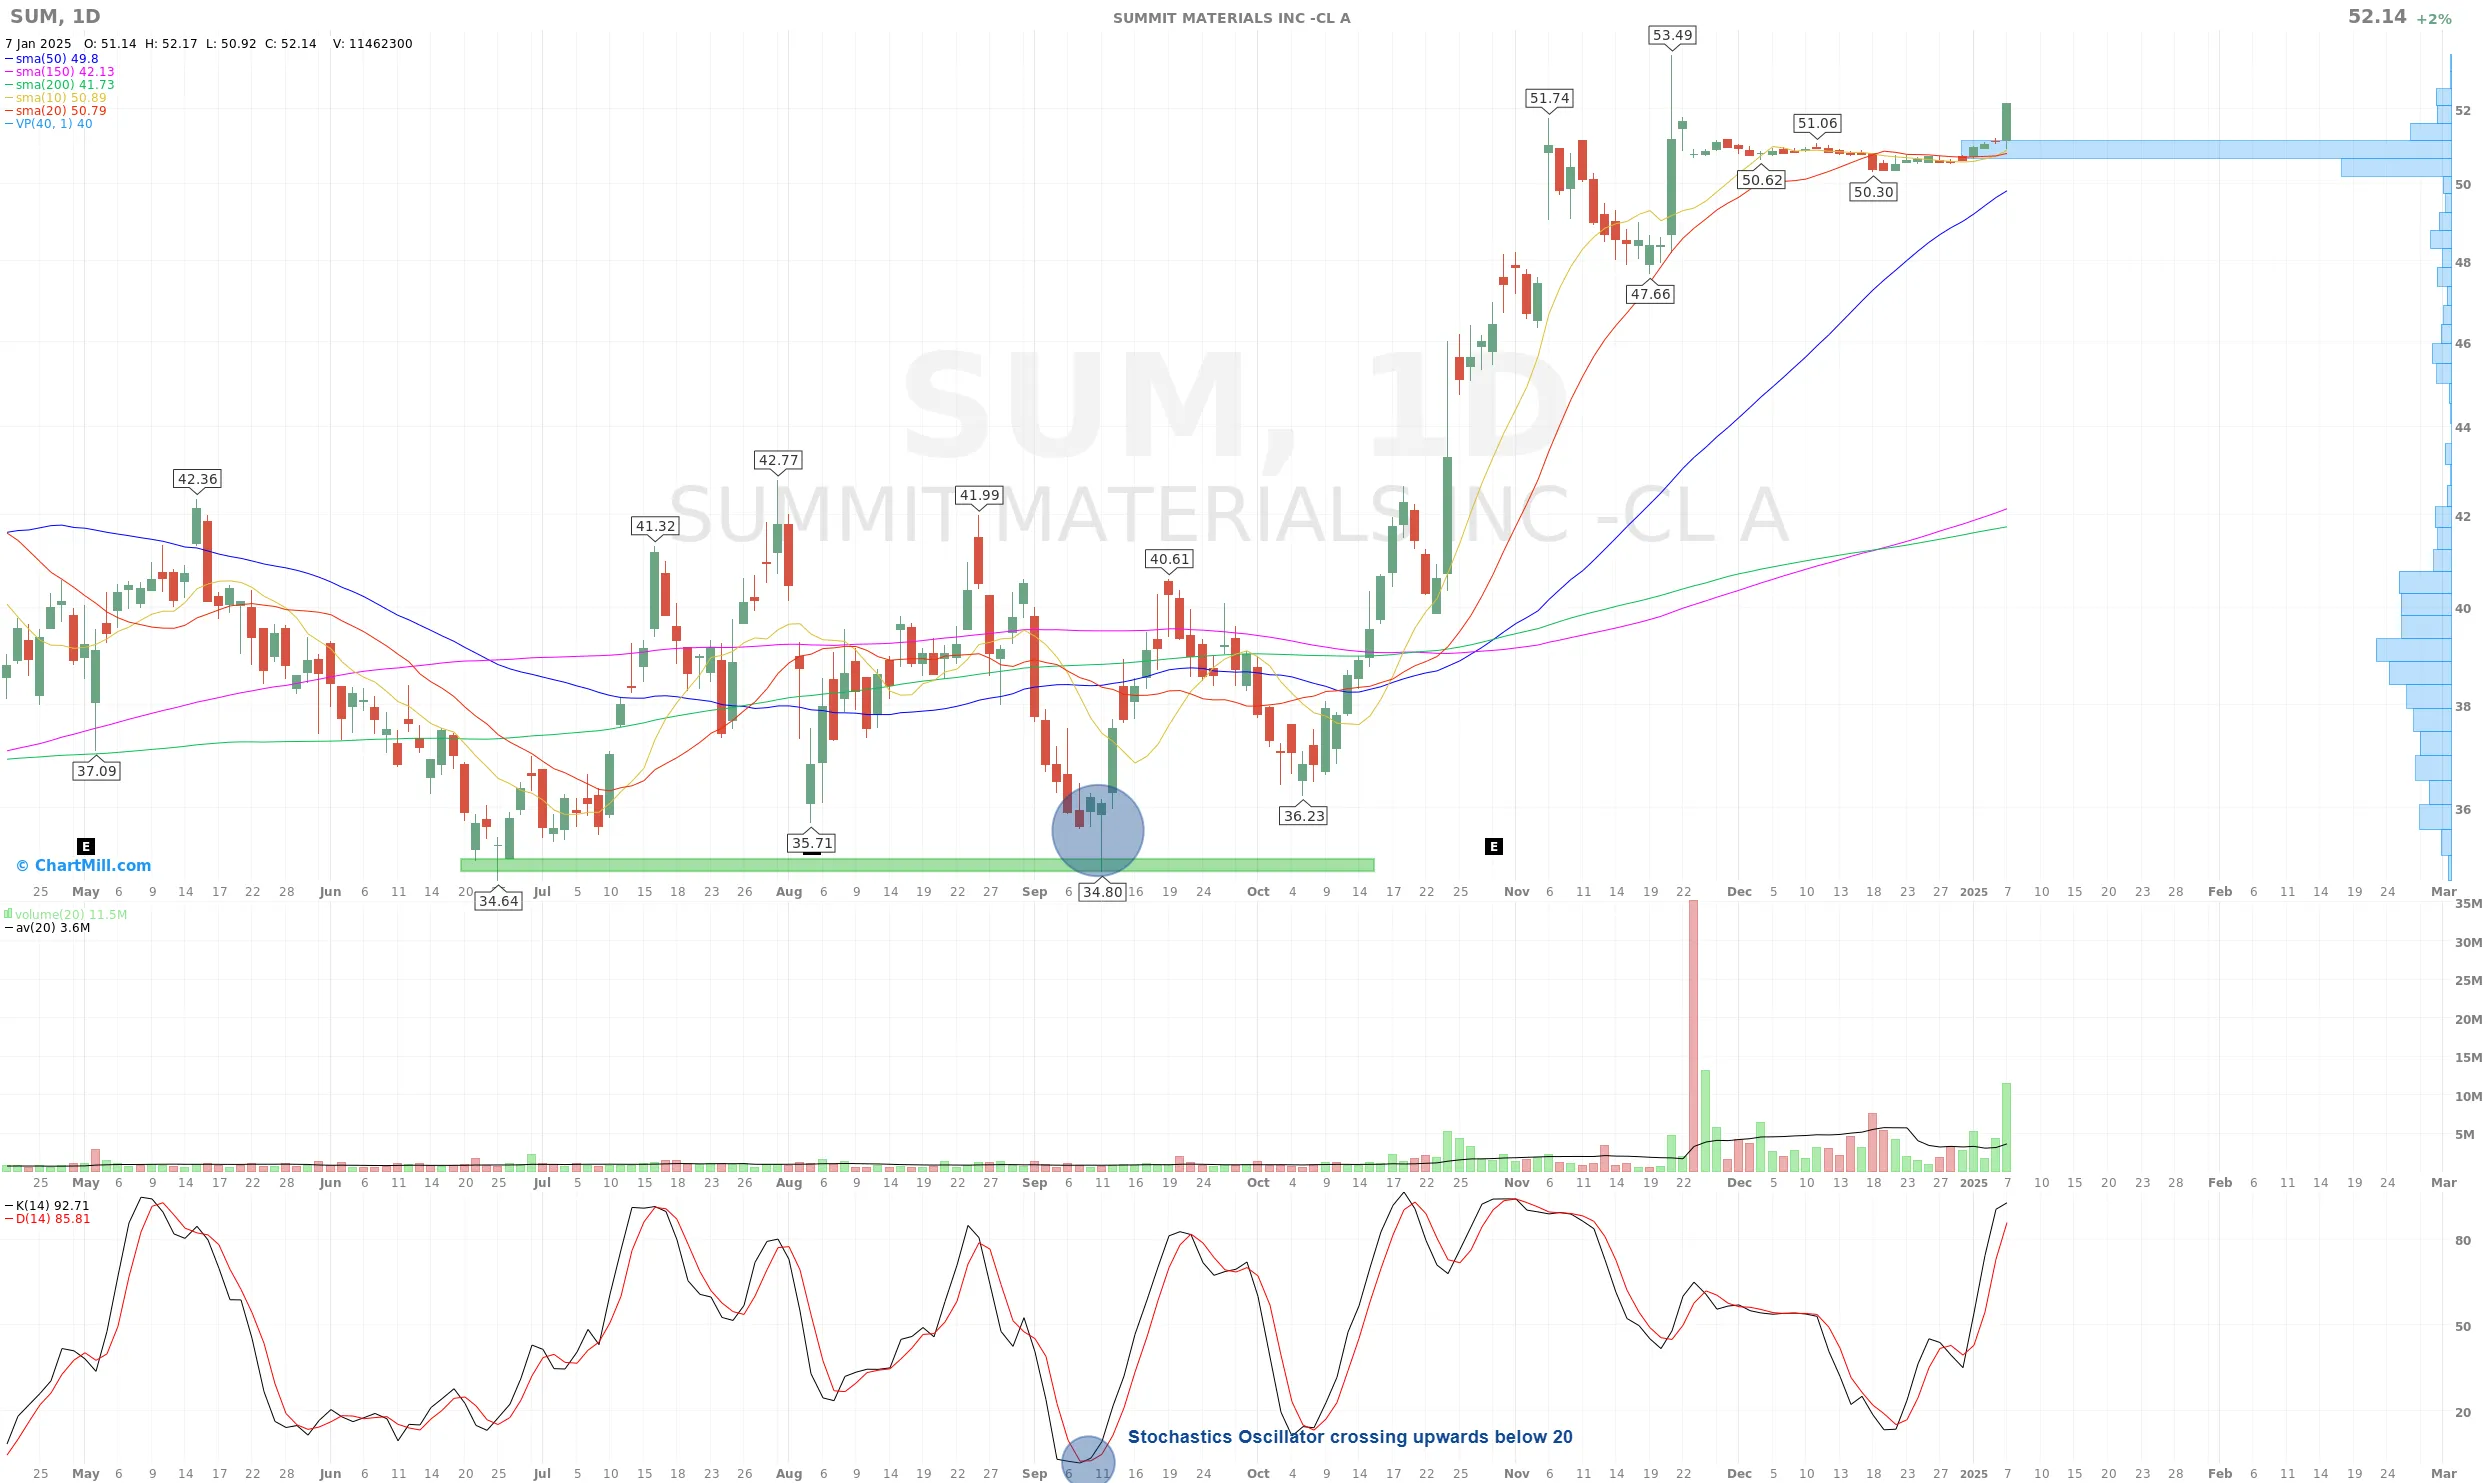
Take a look at the chart for SUM below. Here, we see a dragonfly doji candlestick forming within a sideways trading range, effectively creating a "Double Bottom." The fact that the rejection happened at a known support level gave traders the confidence to hold through the noise.
This specific setup preceded a massive 45% rally, proving that when the Dragonfly defends a proven floor, the upside potential is significant.
Enhancing Accuracy with Technical Indicators
While the candle tells you about price action, indicators tell you about momentum. I use the Stochastic Oscillator as a secondary filter to confirm that the market is "stretched" to the downside.
In the SUM example, notice the Stochastic Oscillator just before the dragonfly doji signal appeared. The indicator had crossed upward from below the 20-line (the oversold zone). This created a "bullish divergence" of sorts: the oscillator showed momentum was turning up just as the Dragonfly Doji provided the visual confirmation of price rejection.
This synergy between price and momentum is what separates a high-probability trade from a gamble.
To wrap up this masterclass, let’s look at a live market example. Theory is essential, but seeing how a dragonfly doji pattern performs under real-world pressure is where the true learning happens.
Here is a breakdown of a high-probability setup using Jefferies Financial Group (JEF).
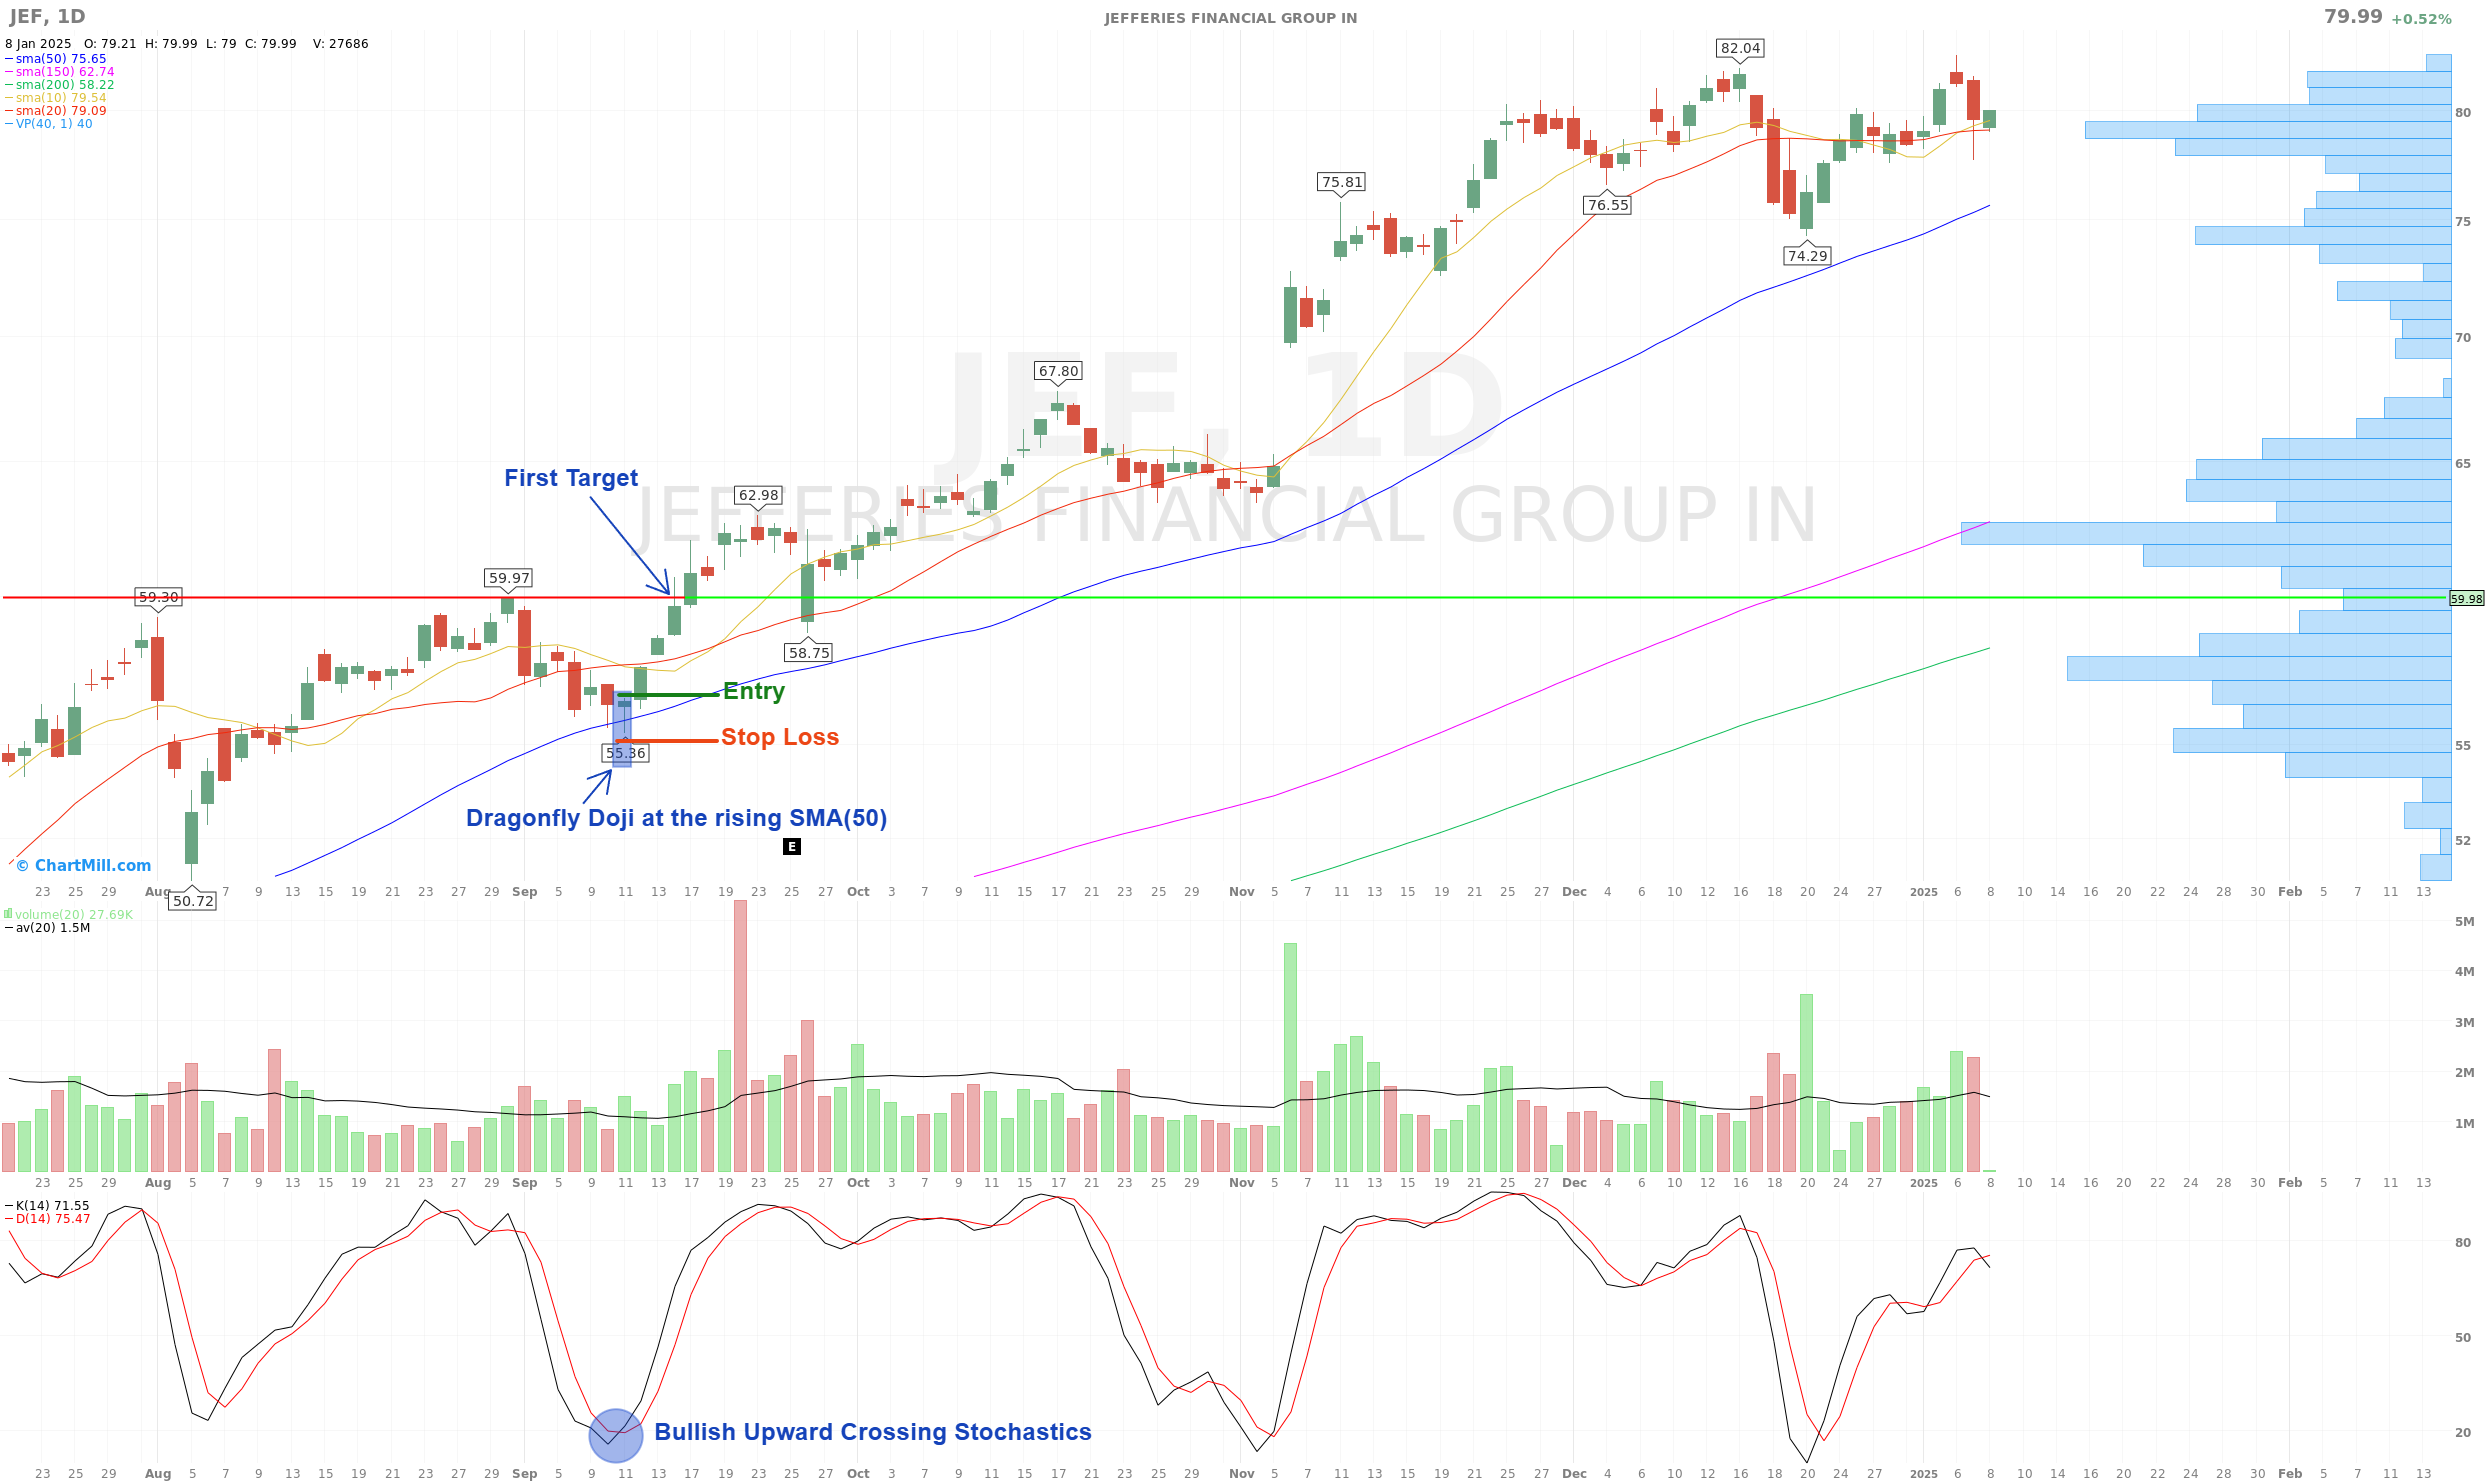
Case Study: The JEF Reversal at the 50-Day SMA
In this daily chart of Jefferies Financial Group (JEF), we see a perfect marriage of price action, trend alignment, and momentum. This isn't just a random "T-shape" on a screen; it’s a calculated strike at a major institutional floor.
The Setup: Multiple Layers of Confluence
I rarely trade a candle in isolation. In the JEF example, we have four distinct signals telling the same bullish story:
The Trend Floor:
The stock is in a clear, healthy uptrend (higher highs and higher lows). The dragonfly doji candlestick formed exactly as the price "kissed" the rising 50-day SMA (blue line). In my experience, the 50-day SMA often acts as the "line in the sand" for institutional buyers.
The Momentum Trigger:
Look at the Stochastic Oscillator below the chart. Just as the Dragonfly formed, we saw an upward crossover. This tells us that while the bears tried to break the price, the underlying momentum had already begun to shift back to the bulls.
The Volume Profile:
On the right side of the chart, the horizontal histogram shows a "high volume node" near the SMA. This confirms that significant capital has been exchanged at this price level before, making it a "sticky" area where buyers are likely to defend their positions.
The Execution: Entry, Stop, and Target
A professional trade is defined by its exit plan before the entry is ever taken.
The Entry:
We place the buy order just above the high of the dragonfly doji candlestick. This ensures we are only "in" once the market proves the bulls have sustained the recovery from the previous day’s rejection.
The Stop-Loss:
Risk is managed by placing the stop just below the long lower shadow of the Dragonfly. If the price breaks that low, our "failed coup" thesis is invalidated, and we exit with a small, controlled loss.
The Target:
Our first profit target is set at $59.97, a clear horizontal resistance level where sellers have previously stepped in. This provides a healthy reward-to-risk ratio.
The Reality Check: Risk Management is Your Only Edge
While the dragonfly doji pattern is a top-tier signal, I must emphasize one thing: the market does not owe you a profit. No pattern, regardless of how "perfect" it looks, is a guarantee.
Trading is a game of probabilities. Even a textbook Dragonfly Doji at major support can fail if a surprise earnings report or a macro-economic shift hits the tape. Losing trades are not a sign of failure; they are simply the "cost of doing business."
The key to longevity in this game is not finding a 100% win-rate pattern, it’s managing your downside. By using disciplined stop-losses and only taking setups with clear confluence, you tip the scales in your favor over the long run.
Deep Dive: To truly master the defensive side of the game, I highly recommend reading our guide: Swing Trading Risk Management: Navigating Volatile Waters.
Always remember: the dragonfly doji signal is a powerful ally, but it should only be one piece of your broader analytical puzzle.
Frequently Asked Questions: Mastering the Dragonfly Doji
1. What is the main difference between a Dragonfly Doji and a Hammer?
While both are bullish reversal signals, the dragonfly doji candlestick is more extreme. A Hammer has a small real body, meaning the bulls won the day but there was still some price spread between the open and close. In a true Dragonfly, the open and close are identical (or nearly so). This represents a "perfect" rejection of lower prices, making the Dragonfly a technically purer signal of a sudden sentiment shift.
2. Can a Dragonfly Doji appear at a market top?
Technically, yes, but its meaning changes completely. If it appears at the peak of an uptrend, it is often viewed as a "Hanging Man" variant or a sign of extreme volatility rather than a reversal. The high-probability dragonfly doji pattern is historically a bottoming signal. At a top, I would be much more cautious and wait for significant bearish confirmation before assuming the trend is over.
3. Does the color of the Dragonfly Doji matter?
Since a true Doji means the open and close are exactly the same, it technically has no color. However, in modern electronic markets, the close might be a few cents higher (green) or lower (red) than the open. I always prefer to see a "green" finish. A green close reinforces the idea that the bulls had the final word in that session's tug-of-war.
4. Why is the Gravestone Doji mentioned as the opposite?
The Gravestone Doji is the mirror image of the Dragonfly. It has a long upper shadow, meaning the bulls tried to rally during the session but were completely crushed by the bears by the close. While the Dragonfly represents "hope being born," the Gravestone represents "the rally dying." They are the two psychological bookends of market reversals.
5. Which timeframe is most reliable for this signal?
For a high-conviction dragonfly doji signal, I stick to the Daily or Weekly charts. On a 5-minute or 15-minute chart, a Dragonfly often just represents a few minutes of low liquidity or a temporary "glitch" in orders. On a Daily chart, however, it represents a massive shift in institutional sentiment that can sustain a new bullish trend for weeks.
Other Doji Candlestick Chart Patterns
Understanding the Gravestone : A Bearish Reversal Warning Signal in Trading
The gravestone doji candle pattern is considered a bearish reversal signal in a bullish trend. More details