Low Float Stocks: How to Profit from High Volatility?
By Kristoff De Turck - reviewed by Aldwin Keppens
Last update: Feb 4, 2025

Low float stocks are stocks with a relatively small number of shares available for public trading.
The float refers to the number of shares that are freely available for investors to buy and sell (public and institutional), excluding restricted shares held by insiders, company executives, or major stakeholders.
These kind of stocks can offer incredible profit opportunities, but they also come with significant risks. Understanding how they work is crucial for traders looking to capitalize on their extreme volatility.
Characteristics of Low Float Stocks:
One of the most notable traits is high volatility. Because the supply of available shares is limited, even a small amount of buying or selling activity can cause significant price fluctuations.
Another characteristic is low liquidity. With fewer shares available for trading, the overall trading volume tends to be lower, making it more challenging for investors to buy or sell at their preferred prices.
These stocks also have the potential for large price movements. When demand increases, low float stocks can experience sharp and rapid price spikes within a short period.
Additionally, low float stocks are more susceptible to market manipulation. Due to the small number of shares in circulation, these stocks can be more easily influenced by traders or market participants attempting to drive prices in a specific direction.
Example of a Low Float Stock - Cyclerion Therapeutics Inc. - CYCN:
An example of a low float stock is Cyclerion Therapeutics Inc. (CYCN), which, as of January 31, 2025, had a float of approximately 2.07 million shares.
On that day, CYCN opened at $3.34, reached a high of $4.47, a low of $3.04, and closed at $3.92, with a trading volume of 82.47 million shares, reflecting a 54.33% increase in price.
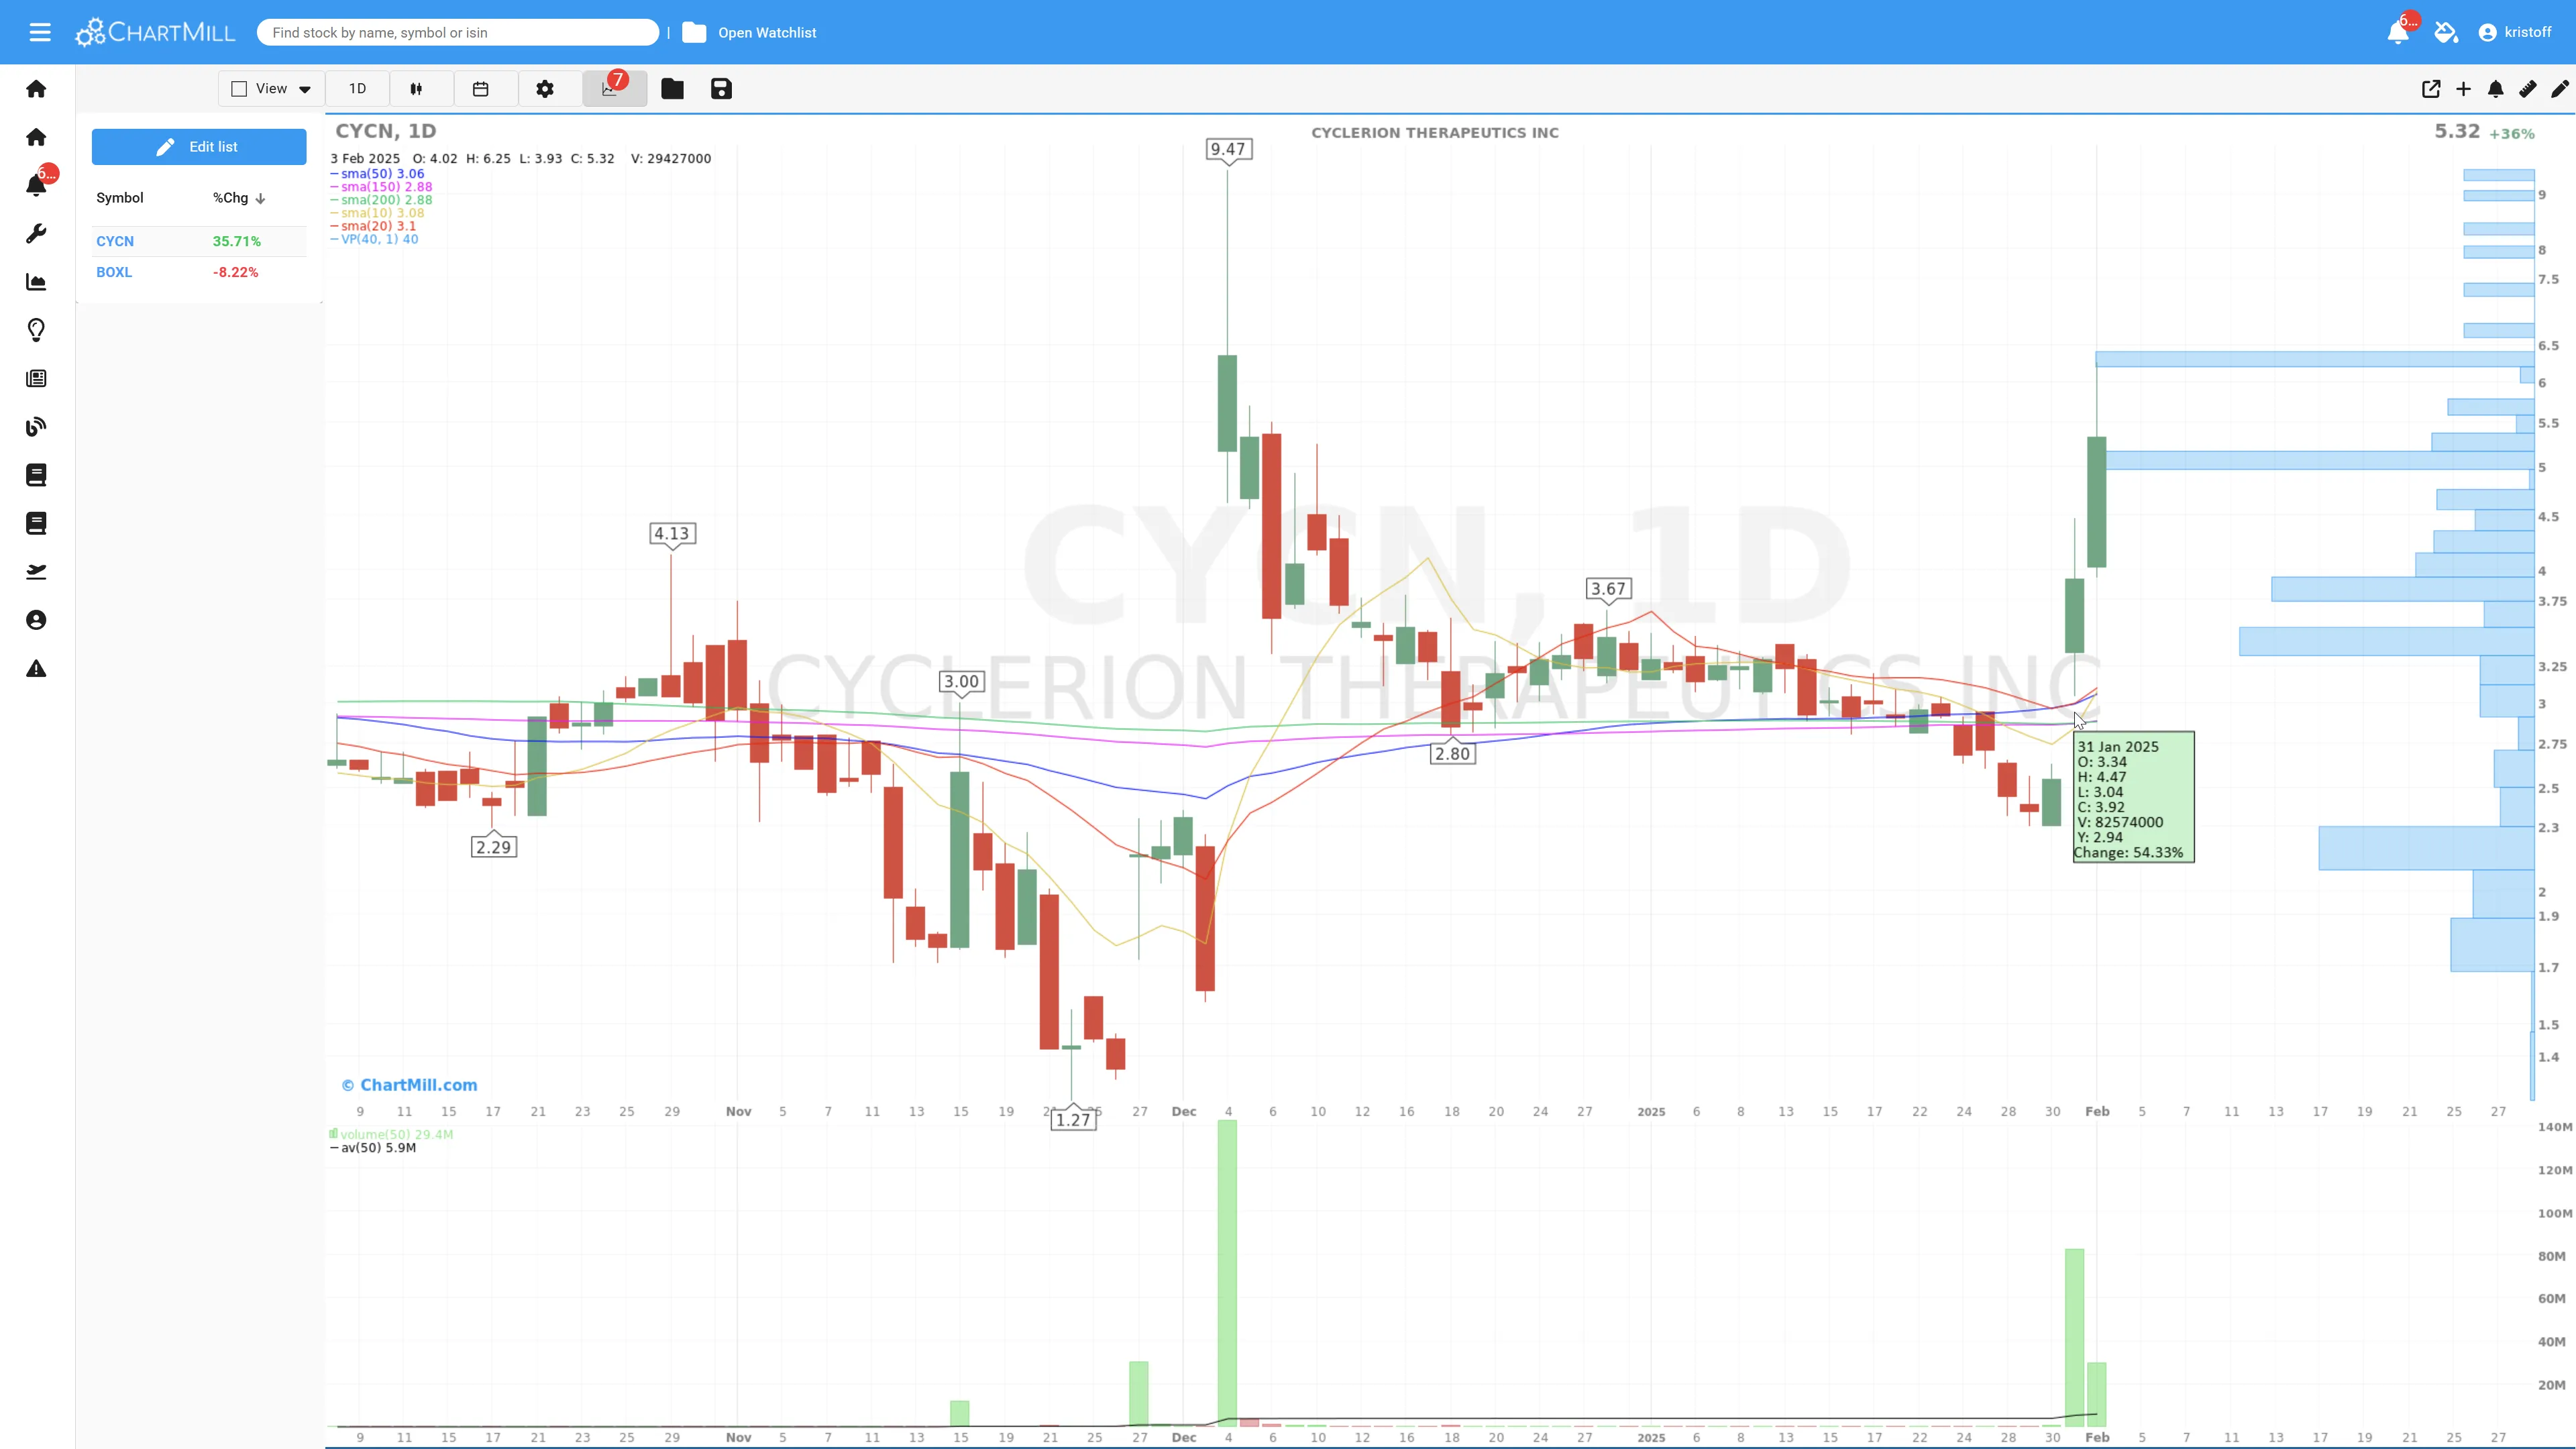
This significant price movement illustrates the high volatility characteristic of low float stocks, where limited share availability can lead to substantial price fluctuations in response to market demand.
Example 2 - Boxlight Corporation - BOXL:
Boxlight Corporation (NASDAQ: BOXL) is another example of a stock with a low float (< 10 million).
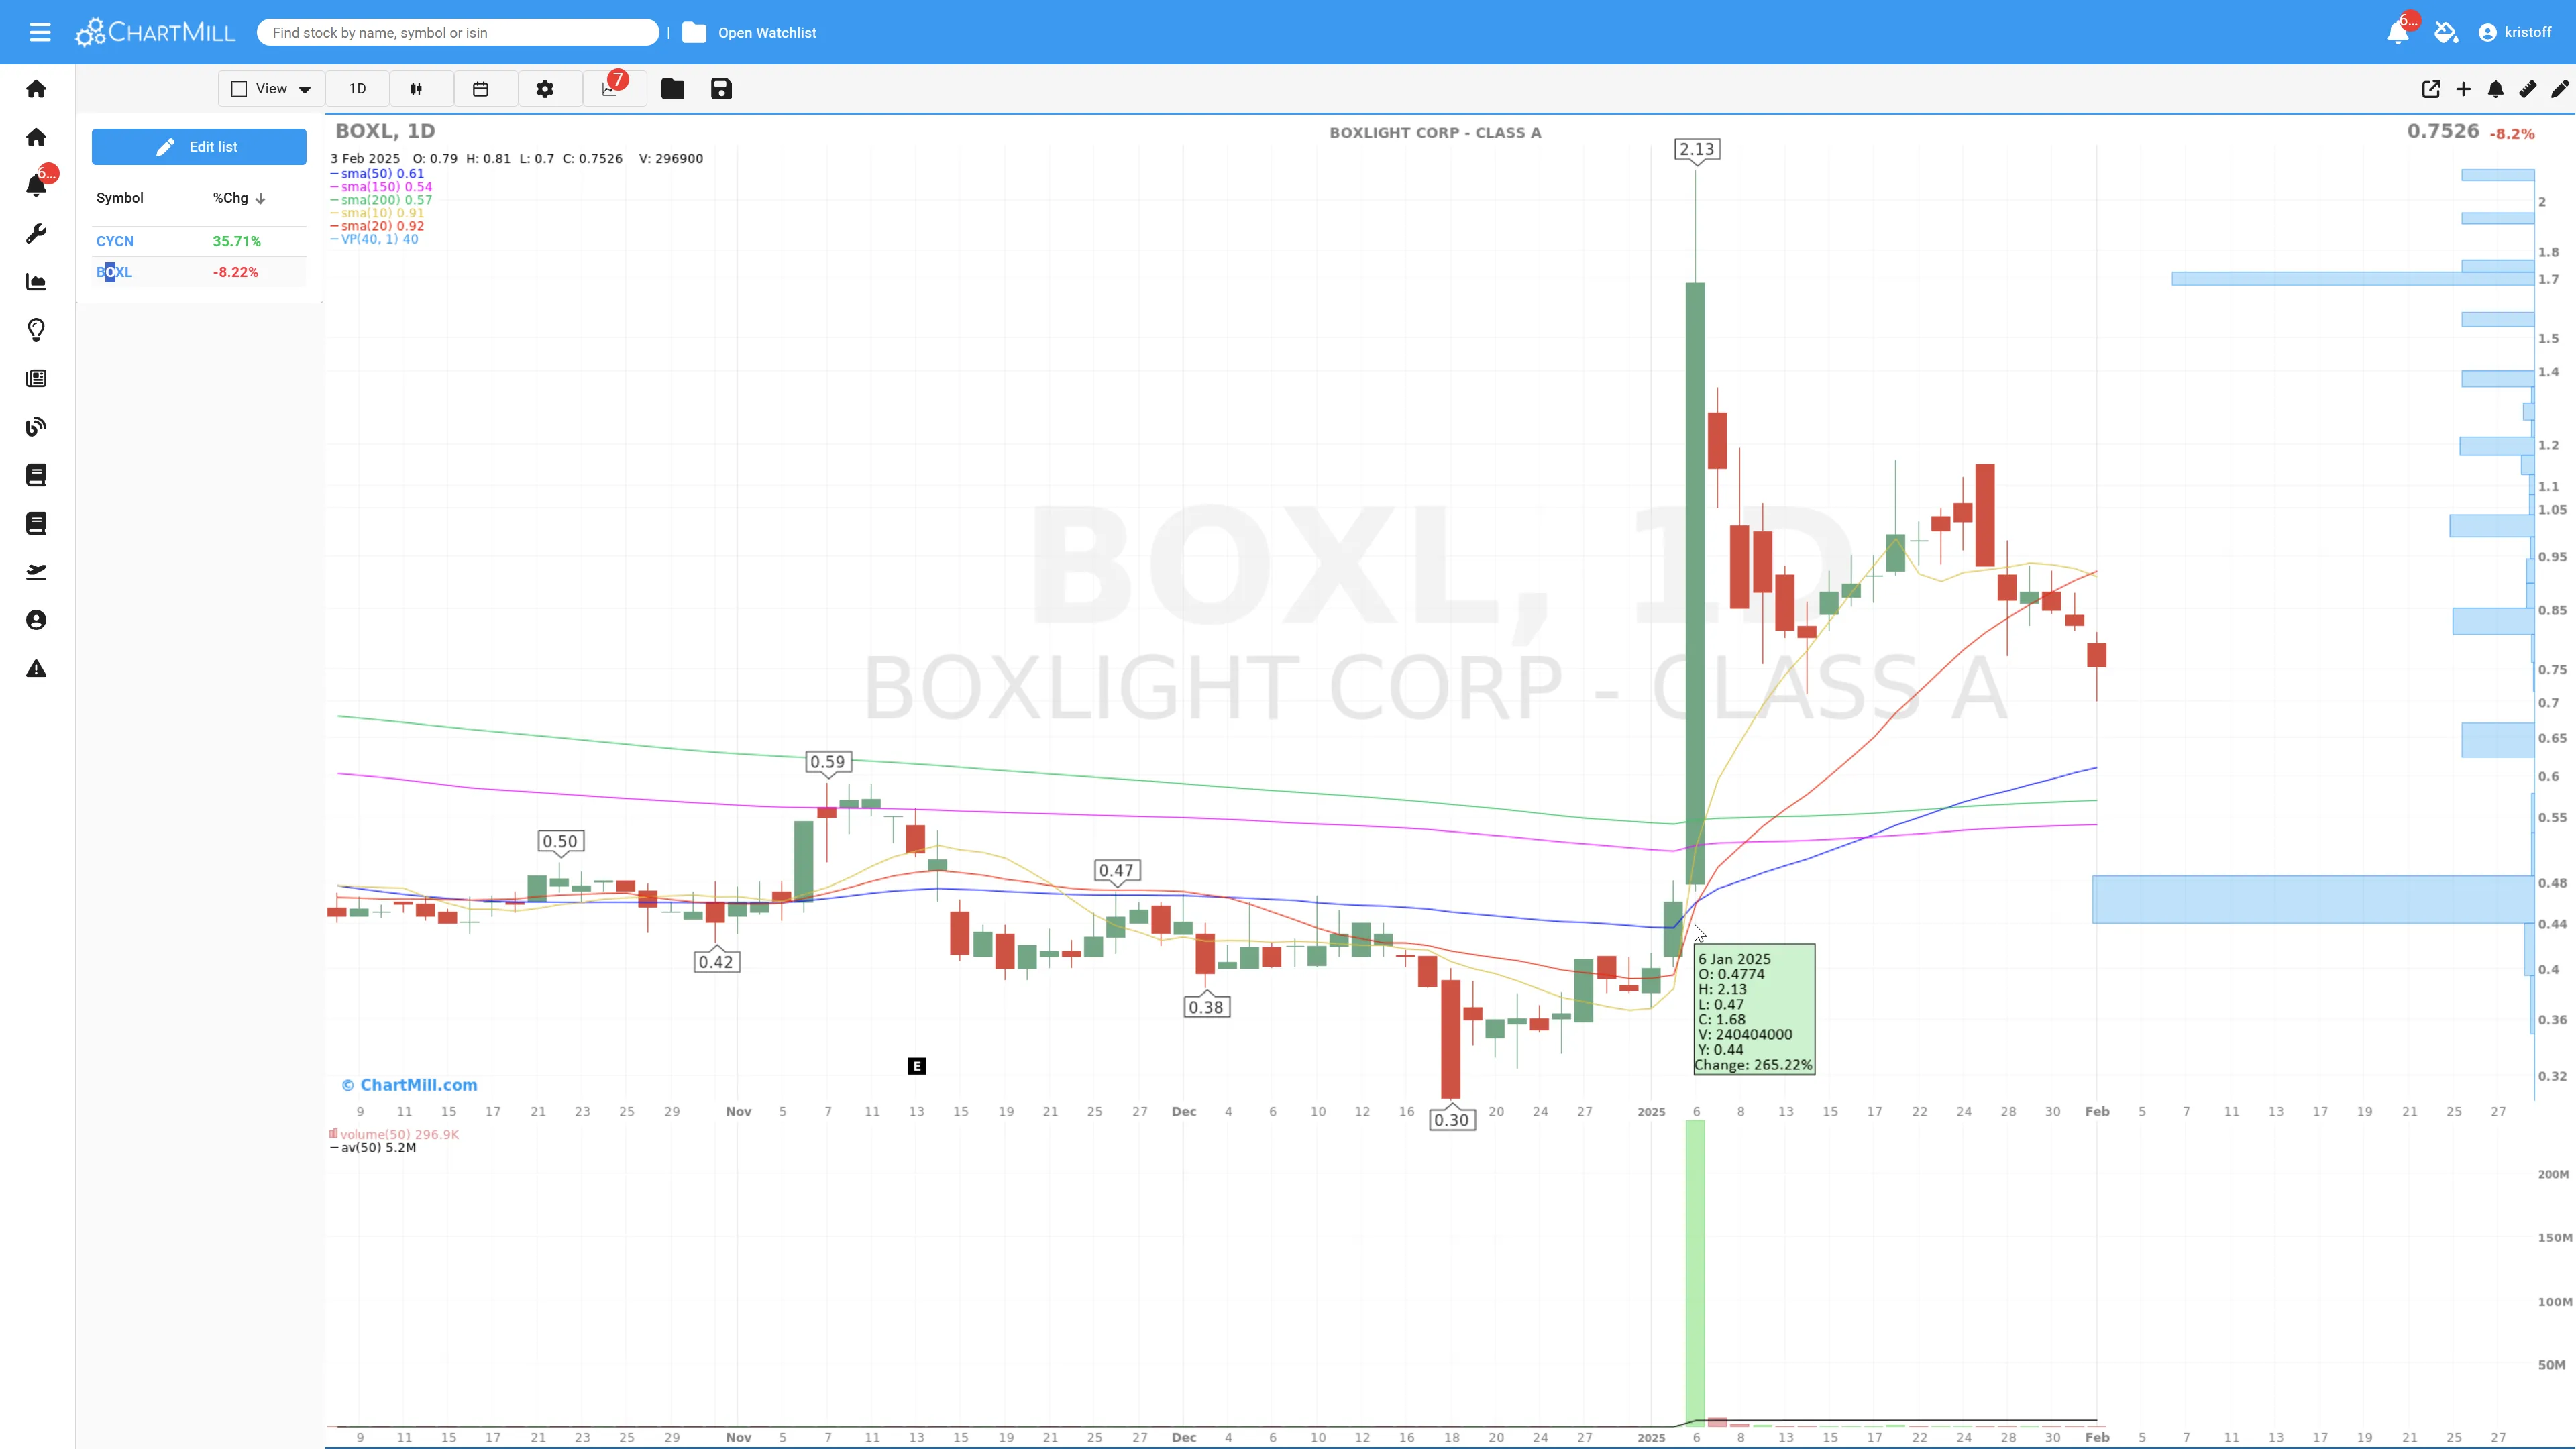
On Jan. 6, 2025, the stock reached a new 52-week high of $2.13 and eventually closed at $1.68. This was a spectacular increase of more than 265% with an abnormally high trading volume of about 238 million shares.
By comparison, the average daily volume (calculated over the last 20 days) is only 12 million shares.
It is another proof that stocks with a low float ( and in this case a very low price) can be subject to huge volatile price movements when investors suddenly catch sight of the stock and demand exceeds supply many times over.
Key Metrics to Identify Potential Opportunities in Low Float Stocks
-
The actual Float - Low float stocks typically have less than 10 million shares in float, making them prone to sharp price movements.
-
High(er) Volume - Look for stocks where the average volume is increasing, indicating unusual activity and potential momentum.
-
Short Interest - This metric measures the percentage of the float that is being shorted. A high short interest (>20%) can lead to short squeezes, where traders rush to cover short positions, driving the price up rapidly.
-
Market Capitalization - Most low float stocks are small-cap (300M < 2B) or micro-cap stocks (50M < 300M).
-
Specific catalysts (News, events,...) - Earnings reports, FDA approvals, contract wins, and partnerships can trigger major moves in low float stocks.
Low Float Stock Screener Criteria
Here’s how to screen for such stocks using ChartMill's Low Float Screener:
Key Screening Criteria
- Liquidity & Float
- Float: Less than 10 million shares (ensures limited supply)
- Average Volume (50 days): At least 300K shares (ensures tradability)
- Volume Increase: Volume more than Vol (50)
- Momentum & Price Action
- Price Change (%): Up at least 5% in the last session (shows strong buying pressure)
- ADR (20)%: Above 4, indicates high volatility and large price swings
- Short Float %: Above 5%, creates potential for a short squeeze scenario
- Stock Type & Market Cap
- Market Cap: Below $2B (focuses on small-cap and nano-cap stocks)
- Price: Above $1 (avoids ultra-low penny stocks with poor liquidity)
You can use these criteria to scan for high-potential low float stocks directly in ChartMill.
A Recent Trading Setup in Reborn Coffee Inc (REBN)
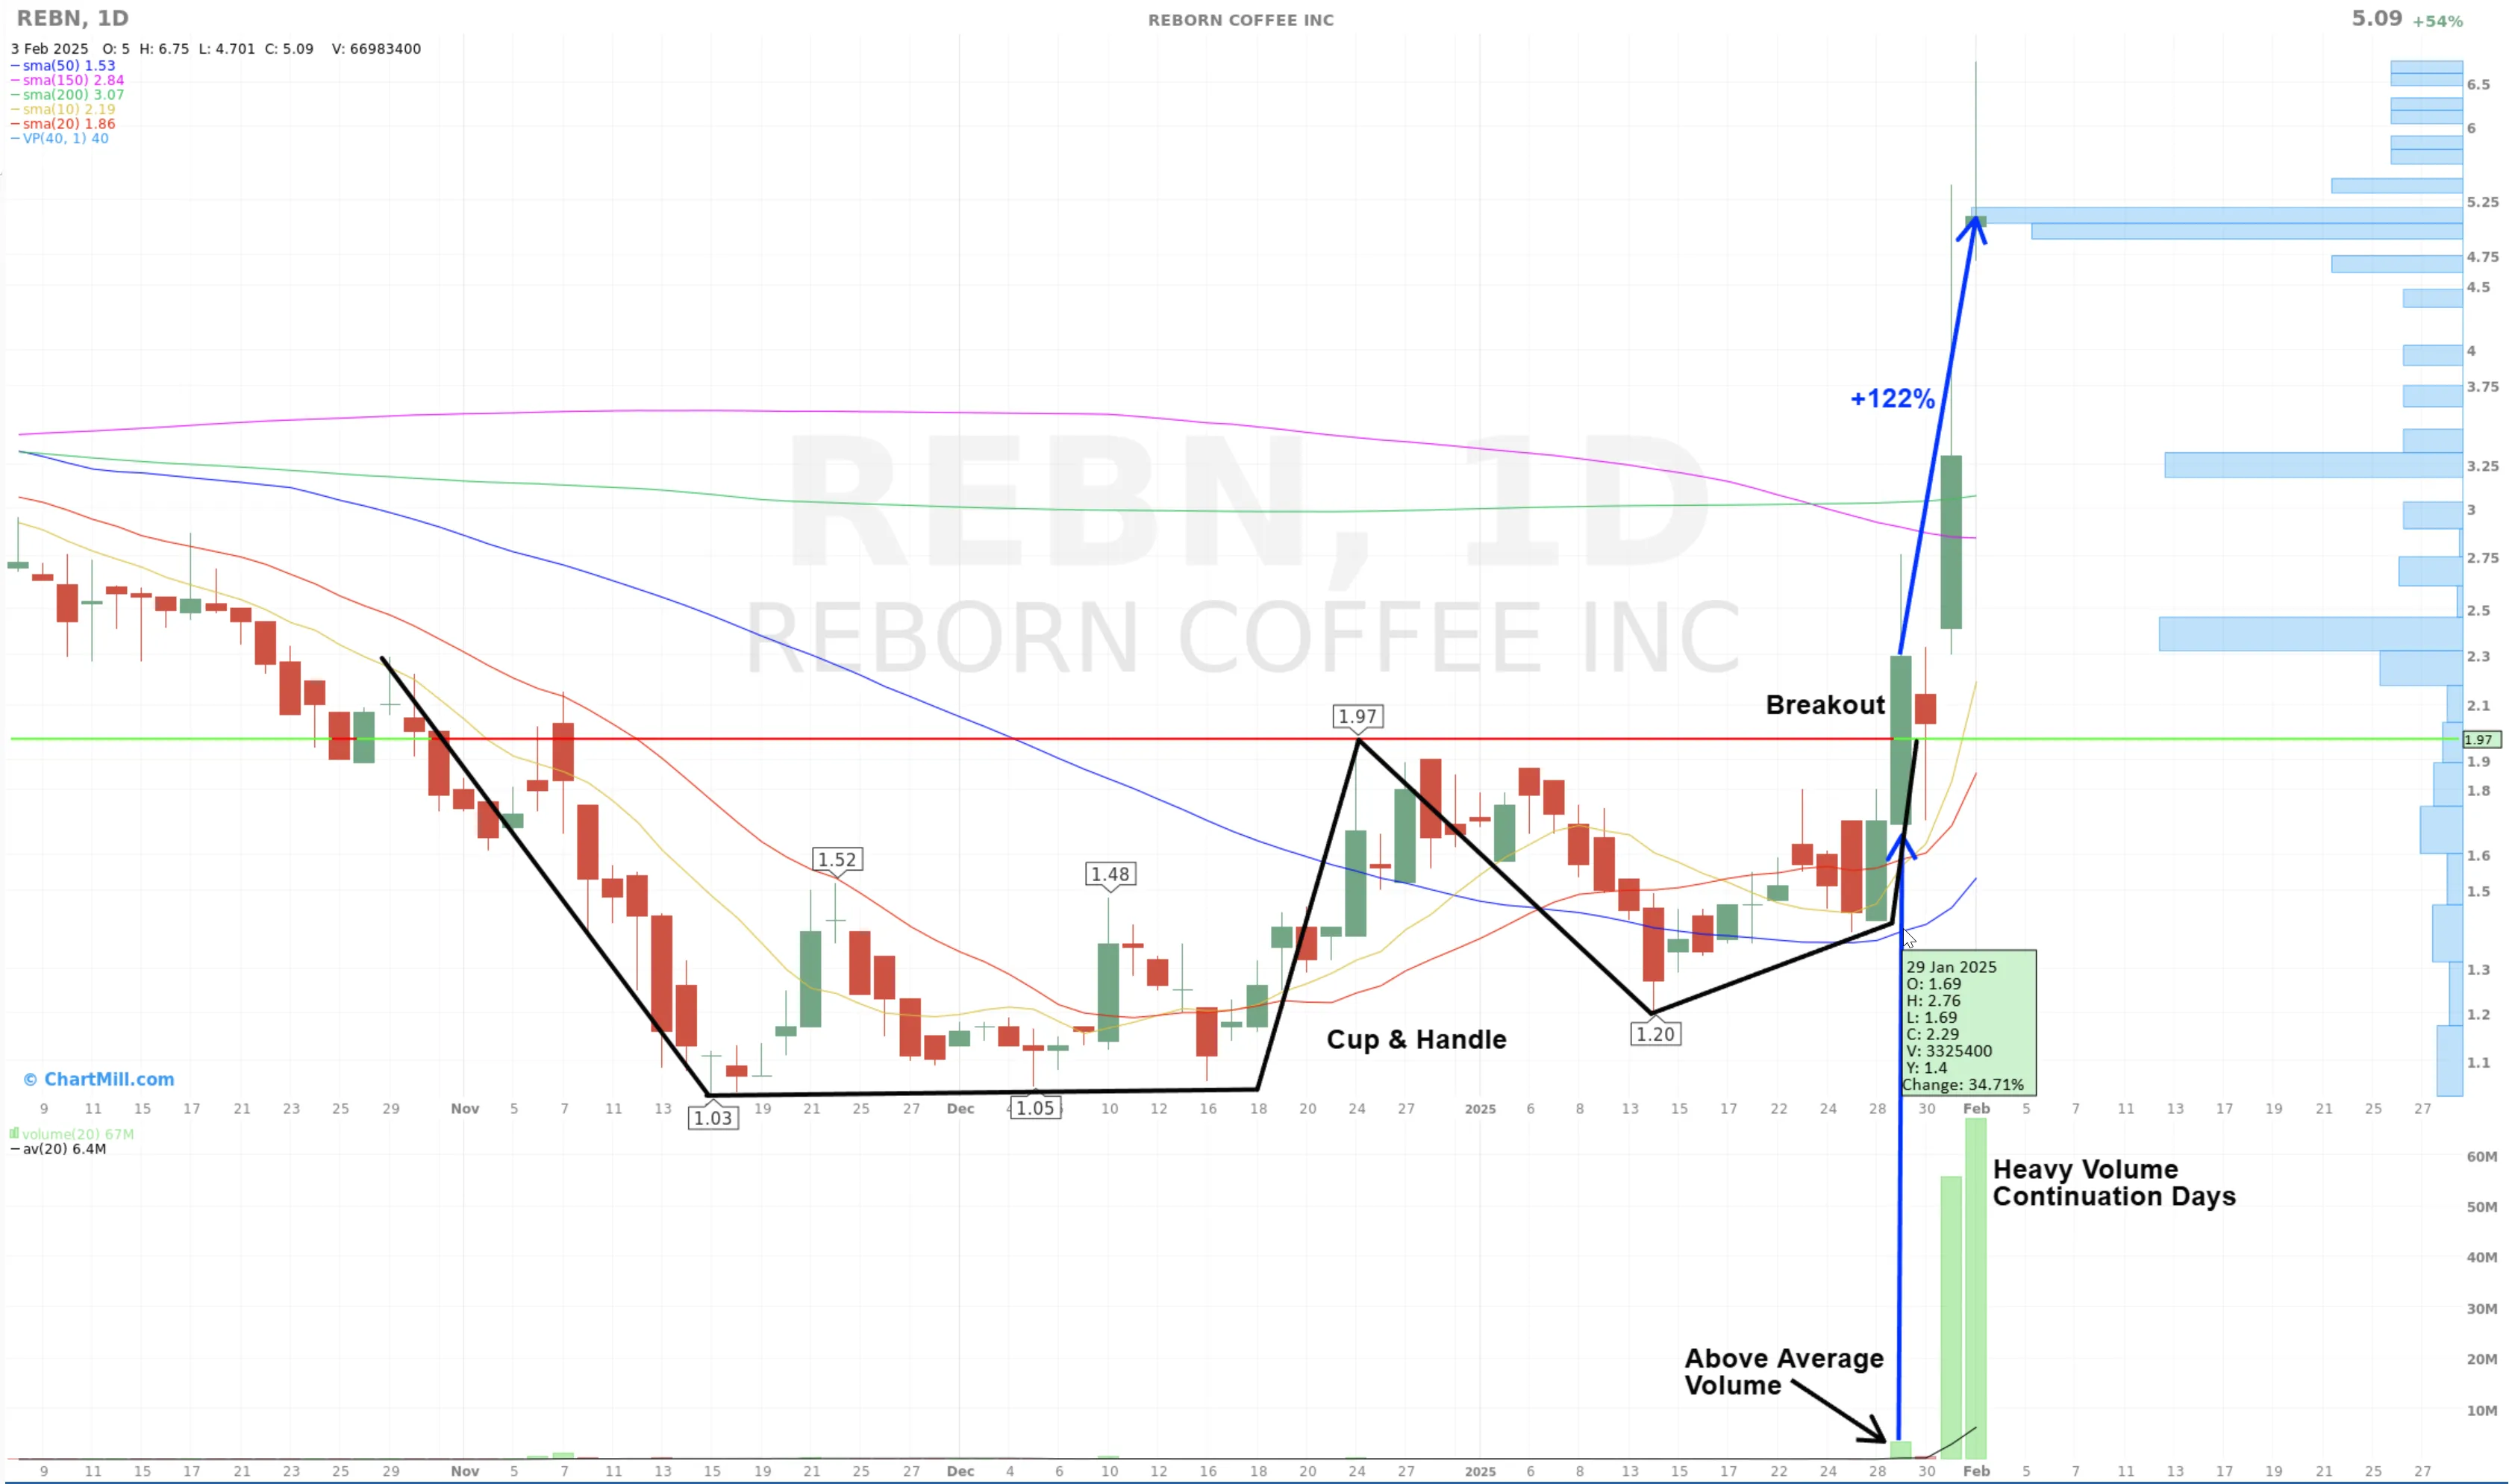
Key Observations:
-
The daily chart is showing a well-formed bullish Cup&Handle pattern between November 2024 and January 28th, 2025.
-
January 29 shows a breakout candle and a significant above average volume surge, a strong confirmation of momentum. That day the stockprice went up more than 34%.
-
The following day (January 30), a inside day doji candle appears. Price fell 11%, but volume was much lower than during the breakout move a day earlier.
-
The initial breakout and subsequent price action caught the attention of many interested buyers and the next day, on Friday, Jan. 31, the stock was bought en masse, leading to a price increase of more than 62%.
-
And even after the weekend, on Monday, February 3, the buying enthusiasm had not yet cooled. The stock again rose more than 52% to a closing price of $5.09. The highest intraday price was even quite a bit higher, $6.75.
Look closely at the volume the last two days, those were some huge spikes!
This is a great example of a low float stock breakout. It had a strong technical setup (cup & handle), a low supply of shares, and a volume-driven breakout, leading to an extreme price surge.
The ChartMill Low Float Scanner Trading Idea had this setup noted after the initial breakout on Jan. 29.
FAQ
Should You Trade Low Float Stocks?
Yes, if:
- You are an experienced trader comfortable with high volatility.
- You can react quickly to price movements and use tight stop losses.
- You follow a well-defined strategy (e.g., breakouts, momentum trading).
No, if:
- You are a beginner or prefer slower-moving stocks.
- You struggle with risk management and emotional trading.
- You don’t have a trading plan and just chase hype.
Low Float Stocks for Swing Trading – Is It Possible?
Low float stocks are usually favored by intraday traders because of their high volatility, but swing trading is another great approach.
The same principles apply as for day traders, but there are some additional points of interest:
-
Focus on strong closing candles. If a stock closes near its high on strong volume, it has a better chance of running the next day. Weak closes (candles with a long upper wick, or a breakout candle on very low volume) have a higher risk for overnight holding.
-
Continuation volume is very important when holding the stock. The stock should hold above some important key moving averages (the 5- 10- and 20-day moving average are the most popular among swing traders) while maintaining decent relative volume.
-
Be vigilant on high volume at top or bottom prices (exhaustion moves): Rising volume at the start and sufficiently high volume during a rising trend are necessary elements if the trend is to continue. However, you should be careful if there are sudden new volume spikes after strong upward price movements.
-
Avoid Overextended Moves: If a stock is already up 200%+ in a single day, it’s a lot more risky to hold overnight as profit-taking is likely. This is not an easy one, because many initial breakouts in low float stocks show price moves of sometimes double or triple digits, while the upward movement has just begun. So watch out for stocks that have already risen considerably and suddenly rise very sharply again in a single day. In doing so, there is a significant chance that you are dealing with an exaggerated move.
A Recent Swing Trade in Root Inc. - ROOT

Root Inc. has a market cap of 1.6B with a float less than 10B and a short float % above 10.
- Breakout from an Cup&Handle pattern
- Above Average Volume during the actual breakout
- Strong close, almost at the high of day
- Entry slightly above current high, stoploss below the last candle

- Strong continuation moves after initial breakout
- High volume on up-days after the breakout
- First target at resistance level ($113.22)
- Stop loss changed (close) to the breakeven level

